Distressed Properties & Contradictory Data
By Rick Tobin
The published economic numbers that we see daily or weekly don’t necessarily reflect the reality of what’s going on with the job market, financial markets, and housing sector, especially. Reality can be a bitter pill to swallow, figuratively. Is our economy still booming, starting to soften or flatten, or is it turning negative?
The mainstream media likes to share economic data that’s published by the federal government which seems completely disconnected from reality. While we see articles published weekly about massive layouts from well-known companies like Amazon, Walmart, Disney, PayPal, Zoom, Dell, IBM, Microsoft, Google, Salesforce, Vimeo, Coinbase, and Goldman Sachs, we also see published unemployment data that’s claimed to be near historical lows. These massive layoffs and “near historical low unemployment” numbers seem to be contradictory to one another as they can’t both be true at the same time.
ADVERTISEMENT
What about housing? In early 2023, we are still seeing all-time record highs for median rents and median home prices in most regions of the country. Yet, we’ve also seen mortgage rates increase by two or three times above peak lows as last seen in late 2021 and the 1st quarter of 2022.
Generally, the booming or busting housing markets are tied directly to mortgage rate trends and whether or not loan underwriting is easing or tightening. How can property values still be peaking while we’ve also possibly seen the fastest increase with short-term and long-term rates in US history at the exact same time? This is another fine example of a contradictory marketplace with two extreme opposites at the same time.
Bubble Burst and Suppressed Housing Supply
For many of us, the absolute worst housing market bubble burst that we experienced firsthand was back in 2008. In California and many other states, the housing market started to peak in late 2006 or 2007. The catalyst for this peaking housing market bubble burst was directly related to the Federal Reserve’s aggressive rate hike campaign over the period of 24 months between June 2004 and June 2006. The Fed raised rates a total of 4.25% from 1% to 5.25% with 17 separate rate hikes.
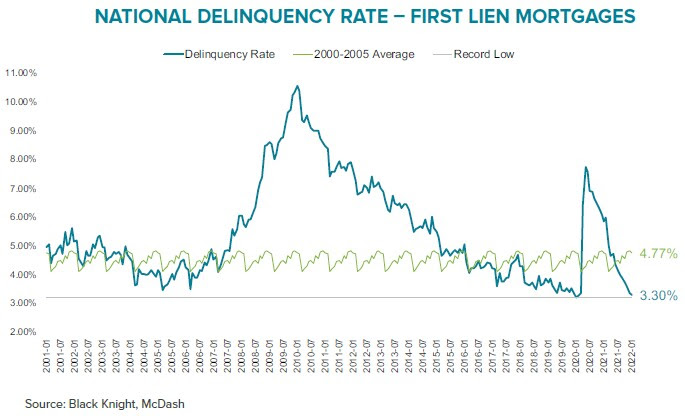
Because so many borrowers were in adjustable rate mortgages or home equity lines of credit, the mortgage payments began to double or triple for property owners after these 17 rate hikes. As a result, the number of distressed or foreclosure properties reached several million with a high percentage located in California and other Sun Belt states like Nevada, Arizona, and Florida.
Let’s take a look at the worst bubble burst year ever in US history to better understand how bad the price collapse was in 2008:
● Home prices fell in 35 states.
● California had the biggest price collapse at -29.6%.
● Nevada had the 2nd biggest price drop at -22.8%.
● Arizona fell -19%, Florida dropped -18.2%, and Rhode Island fell -13.7%.
ADVERTISEMENT
Even worse, California home prices fell a total of -42% off their previous bubble peak. Nevada’s median price dropped -39% from their peak. Both Arizona and Florida fell -33% from their respective previous market peaks.
Because the number of distressed properties increased so dramatically, a very high number of lenders did not start the foreclosure process even if the borrowers were several years behind on their mortgage payments. If a lender or mortgage loan servicer did initiate the foreclosure and take it all the way to the final auction sale, millions of these properties were not placed up for sale as they became a massive shadow inventory of unoccupied homes.
Many lenders did not want to acknowledge or share how bad their non-performing loan portfolio was at the time with their stockholders, equity partners, or derivatives investors. If the lenders did foreclosure on every delinquent mortgage in their portfolio, it might financially crush the same lender. As a result, it wasn’t unheard of to read about homeowners in Beverly Hills mansions with $5 million loans who hadn’t made one mortgage payment in three years or longer.
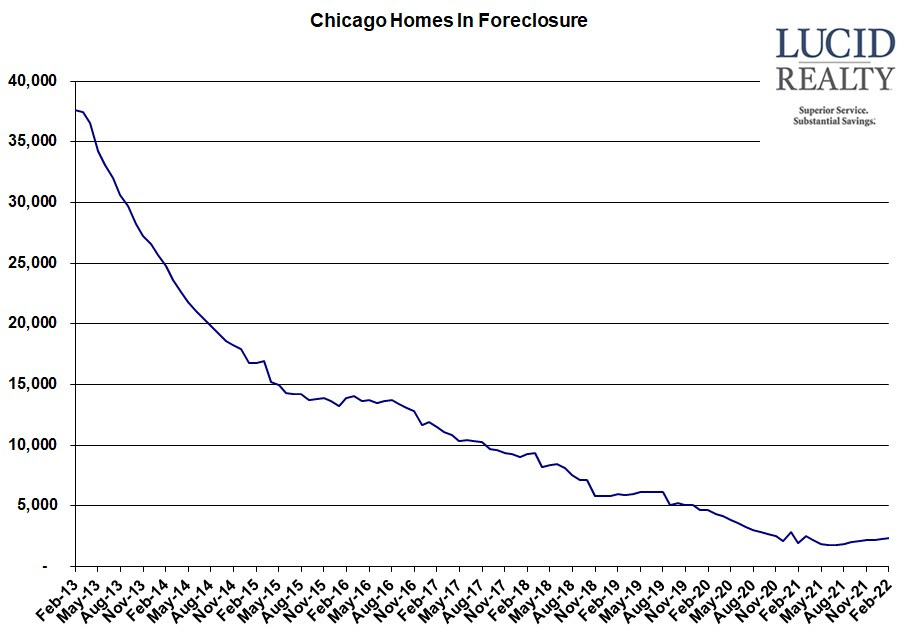
The same thing is happening today here in 2023. Lenders aren’t starting the foreclosure process as often as they’re legally entitled to due to borrowers not making payments for months or years. It’s also been claimed by many people that the current number of millions of empty shadow inventory homes that are not currently listed for sale may exceed the total number of all homeless people nationwide. Whether this claim is accurate or not as it would be incredibly challenging to prove, our current listing home supply nationwide is still near historical lows.
For those people who claim that the housing market is busting, home prices nationwide increased by +10.1% year-over-year through October 2022 in spite of mortgage rates doubling or tripling in less than a year, according to CoreLogic. This home price “slowdown” is still almost two or three times higher than historical annual price gains.
Record High Consumer Debt & Rents
Total credit card debt reached a new record high of $930.6 billion in the fourth quarter of 2022, according to data released by TransUnion. At the same time, credit card rates and fees reached all-time record highs with average annual rates exceeded 20% for many consumers.
Consumer credit spending fell by a whopping 65% from November ($33.1 billion) to December 2022 ($11.56 billion) in spite of it being the traditionally peak holiday spending month. This is a potential major warning sign that a high percentage of consumers are tapped out and/or their credit card lenders are starting to drastically reduce the borrowers’ ceiling limit.
Several published economic surveys discovered that most of the polled consumers did not have $500 as cash available to cover any unexpected financial emergencies like with medical bills, rising utilities, or skyrocketing grocery costs. One of the most important pieces of information about the health of the economy is directly related to the typical consumers’ cash reserves. When access to cash is near historical lows and rents and mortgage payments are at historical highs, then something has to give at some point.
How can people qualify and afford these astronomical rents for just a 1-bedroom apartment that are listed below? Please keep in mind that many landlords want to see their tenant applicants have gross monthly income that is at least three times the proposed rent. For places like New York City, this would be equal to $11,370 in gross income to qualify for a typical one bedroom apartment that’s leasing for a median of $3,790 per month.
Top 5 Most Expensive Rent Cities (1-Bedroom Apartment)
1. New York, NY: $3,790
2. Boston, MA: $3,000
3. San Francisco, CA: $3,000
4. Miami, FL: $2,660
5. San Jose, CA: $2,540
Source: Boardroom
In many regions, the monthly rents are higher than the median mortgage payments. This trend is unlikely to continue onward as mortgage rates rise and rents start to flatten or fall.
Rising Rates and Distressed Properties
In some metropolitan regions like Los Angeles, they’ve had two and three year long moratoriums that protect tenants from paying their rents due to the Covid issue. Most landlords are small “Mom and Pop” type landlords who may be fortunate to own just one or two rentals. If their tenants haven’t paid rent in two or three years, then the property owner may default on their own mortgage and lose it to foreclosure, sadly.
Lenders and loan service companies will likely start to accelerate their foreclosure filings later this year. If so, this can be traumatizing for the distressed homeowners who may soon lose all of their equity and their roof over their head. At the same time, it can be an investment opportunity for others who keep their eyes open for bargain deals.
As of February 10, 2023, the Fed Funds Rate is at 4.58%. Some financial analysts think that the Fed may take their core rate up to 6% or higher later this year and keep it there for a relatively long period of time. If so, how will existing homeowners and buyer prospects be able to afford higher payments?
Many savvy real estate investors and licensees are now starting to describe early 2023 as a bit reminiscent of 2008. Yet, many others will say that the “the relatively low available supply home listing inventory” will protect us from any sort of a double-digit price collapse. While this may be very true and the Fed may be forced to suddenly start cutting rates in the near future if the economy really weakens, what happens if the shadow inventory is slowly released to the general public and the tenant and foreclosure moratoriums are lifted?
With any perceived positive, neutral, or negative situation, it’s usually very wise to focus on potential solutions for as many possible housing trends that may or may not happen in the near future. Few of us like to actually address possible negative situations as we remain stuck in the state of denial and cognitive dissonance where two contradictory situations must both be right at the exact same time even though they can’t both be true. What we avoid in life controls us, so we must face our fears head on and stay focused on the opportunities or solutions.
Rick Tobin
Rick Tobin has worked in the real estate, financial, investment, and writing fields for the past 30+ years. He’s held eight (8) different real estate, securities, and mortgage brokerage licenses to date and is a graduate of the University of Southern California. He provides creative residential and commercial mortgage solutions for clients across the nation. He’s also written college textbooks and real estate licensing courses in most states for the two largest real estate publishers in the nation; the oldest real estate school in California; and the first online real estate school in California. Please visit his website at Realloans.com for financing options and his new investment group at So-Cal Real Estate Investors for more details.
Learn live and in real-time with Realty411. Be sure to register for our next virtual and in-person events. For all the details, please visit Realty411.com or our Eventbrite landing page, CLICK HERE.


