Economic Update – June 2021
Photo from Pixabay
By Lloyd Segal
The one place that’s rip-roaring in our economy is the housing market. In fact, home prices are accelerating, as the Case-Shiller 20-City Index shows. Year-on-year gains rose to 13.3% in April, from 12% in March. Still, that’s a composite of 20 big cities. You might expect the broader FHFA national index to show more modest gains, but nope. That index showed prices up nearly 14% in April! Does that mean we’re back to the bad old days of the early ’00s housing bubble? No, I don’t think so…yet.
After all, this bump isn’t driven by psychology (hey, buy a house, make a ton of money! Home prices never go down!) so much as real, consumer demand. All you wild millennials (you know who you are) are buying houses all at once. And now that prices are surging, those who haven’t bought are freaking out that they better buy now or be elbowed out of the market for years. So if you’re an investors with properties to sell, you’re in the catbird seat right now.Image from Pixabay
Of course, it would be one thing if builders could quickly scramble to increase housing supply. But not only is that hard to do normally, it’s nearly impossible these days with shortages and huge price hikes on key building elements, including lumber and labor. The main homebuilder index is down 7.5% this month (although it’s still up 30% this year). Still, it doesn’t mean that all homebuyers in this market are losing out. In fact, selling your home and relocating to a better market–now that work-from-home has exploded–has been a hallmark of this “YOLO economy.” Even people who are paying over-asking price in Utah, for instance, may still be pocketing gains if they’re selling in California. So for those of you experiencing the Yolo Economy, let’s wash our hands, put on our facemasks, social distance, vaccinate, and get under the hood…Photo from Pixabay
New Home Sales Fell 5.9% in April. Newly-built single-family home sales fell 5.9% in April to a 0.863 million annual rate. But sales are up 48.3% from a year ago. The bigger story in the report by the National Association of Home Builders (“NAHB”) was the downward revisions to prior months. In the March report, sales stood at the highest level since 2006. However, now it looks like sales have generally been decelerating since January. That said, even after these revisions sales are still up 18.2% from February 2020 (before the pandemic erupted). This again illustrates how resilient the housing market has been throughout the turmoil of the past year. But one obvious reason for the recent slowdown in sales has been the relentless increase in prices. The median price of a new home is up 20.1% from a year ago (the most since the late 1980s). But it’s not just buyers who are pulling back from the market. Due to higher inflation in costs, home builders are also becoming more cautious about listing new houses too early, waiting deeper along the construction process before making inventory available for sale. The problem is that with the recent runup in lumber prices and the ongoing labor shortage, builders don’t want to sell unfinished properties too early and be left holding the bag if costs balloon even more. Case in point, the NAHB reports that rising lumber costs alone have added $36,000 in cost to the average single-family home. So for the time being at least, look for builders to finish existing units before listing them for sale.
Image from Pixabay
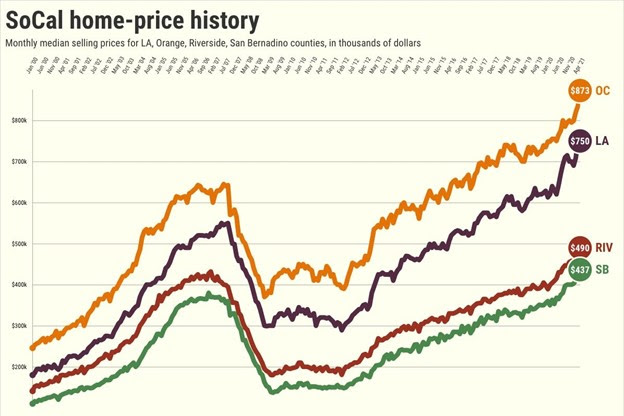
Nevertheless, the number of single-family homes currently under construction are at the highest levels since 2007, so there is a significant backlog that should keep construction activity running on all cylinders for the foreseeable future. As more finished homes become available, expect demand to remain strong and help maintain a rapid pace of sales in 2021.Southern California Home Prices Jump 20% in April. The Southern California hot real estate market just got hotter! April home sales jumped 86.2% year-over-year with a total of 25,857 transactions, up from 13,889 in April 2020, according to data released by real estate firm DQNews. The six-county region’s median home price increased 20.2% year-over-year to a record $655,000, That’s $25,000 more than the previous median price record set in March. The 20.2% leap is the first year-over-year increase of more than 20% since December 2013. It’s both a reflection of the pandemic-fueled housing boom and a market that was chilled by the coronavirus last spring as sales died in escrow and would-be sellers decided not to move. More amazingly, it’s the ninth straight month of double-digit price increases! But why you may be asking? Economists credit a mix of factors including ultra-low mortgage rates, increasing demand for space, and an emerging home-buying demographic: millennials. Another contributor is the housing shortage.
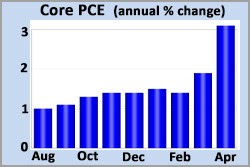
As I’ve previously written, there’s a glut of potential buyers but a shortage of sellers, and it’s leading to bidding wars that drive offers far above the original price tag. Can you imagine, in April, more than half of homes in Los Angeles fetched more than the seller was asking, according to the Multiple Listing Service. Yes, you read that correctly. More than half of the homes sold for more than asking price!Both sales and prices rose in all six counties in Southern California: * In Los Angeles County, the median price rose 19% to $750,000 in April, while sales climbed 101%; * In Ventura County, the median price rose 18.5% to $705,000, while sales climbed 82.4%. * In Orange County, the median price rose 15.6% that month to $872,500, while sales climbed 97.9%; * In Riverside County, the median price rose 19.7% to $489,750, while sales climbed 80.8%; * In San Bernardino County, the median price rose 23.7% to $436,500, while sales climbed 66.9%; * In San Diego County, the median price rose 17.8% to $700,000, while sales climbed 74.1%. Key Inflation Gauge Rose 3.1% Year-over-Year. The “Core Personal Consumption Expenditures Index,” a key inflation indicator, rose a faster-than-expected 3.1% in April as price pressures built in the rapidly expanding U.S. economy, the Commerce Department reports. Federal Reserve officials consider this Index to be the best gauge for inflation, though they watch a number of metrics. As part of its price stability mandate, the Fed considers 2% to be healthy, though it is committed to letting the level average higher than usual in the interest of promoting full employment. The Index captures price movements across a variety of goods and services and is generally considered a wider-ranging measure for inflation as it captures changes in consumer behavior and has a broader scope than the Labor Department’s consumer price index. Including volatile food and energy prices, the PCE index jumped 3.6% year over year and 0.6% from March. That increase in inflation came with a sharp deceleration in personal income, which declined 13.1%.
 Personal income had surged 20.9% in March following the latest round of government stimulus checks you received. Despite the onslaught of inflation increases, most Fed officials remain reluctant to change policy. The central bank continues buying a whopping $120 billion of bonds each month (helping to keep mortgage rates down) and has kept benchmark short-term borrowing rates anchored near zero (even with the rising economy). But there have been some indications recently that the Fed is at least willing to start talking about reducing the pace of bond purchases. Of course, any real action is likely months away. Central bankers see the ongoing price pressures as “temporary,” due to supply chain bottlenecks and comparisons to last year when our economy was largely shut down. Let’s hope they’re right.
Inland Empire 4th Riskiest Housing Market. Investors watch out; the Inland Empire is now the nation’s fourth “frothiest” housing market, according to the “Bubble Watch Index.” What? You’ve never heard of the Bubble Watch Index. Where have you been? The Bubble Watch Index is the monthly homebuying data from Zillow and Realtor.com covering 47 big markets. The “bubble watch” scorecard is based on average rankings for overvaluation (listing prices vs. values); overheating (list-price gains vs. value increases); selling speed (days on market vs. a year ago); year’s inventory change; and year’s rent change.
The Bubble Watch Index grades Atlanta, Georgia, as the nation’s frothiest market followed by Detroit and Jacksonville. Next comes a tie between our next door neighbors to the east, Riverside and San Bernardino counties. Folks seem very willing to dramatically pay more in these “affordable” markets in a feeding frenzy fueled by cheap mortgages and limited choices for house hunters. Just look at these numbers:
No. 4 nationally: Riverside-San Bernardino counties …
Pricing: $512,000 list vs. $460,833 value, or 11% overvaluation (41st)
Appreciation: 22% list vs. 16.2% value, or 36% overheated (No. 10 largest)
Sales speed: 28 days on market, down 50% in a year (No. 7 drop).
Inventory: Down 64% in year (No. 11 decline).
Remember, the Bubble Watch Index reflects “relative exuberance” in these 47 markets. But as I often say, these kind of rankings are part art and part science … so the beauty of any conclusion drawn from this analysis is definitely in the eye of the beholder. In other words, if you’re think today’s overall homebuying conditions are sustainable (I’ll bet you sell real estate), you’d argue the top of the rankings are simply the nation’s “hottest” markets. However, if you’re like me and are squeamish that homebuying has become irrational — plus, you’re here in California — here’s some solace: at least the Golden State isn’t leading the nation in this unnerving buying binge.
Offshore Wind Farms Power California Housing. The federal government plans to open more than 250,000 acres of ocean off the California coast for wind development as part of a major effort to ramp-up the nation’s renewable energy and cut its climate-warming emissions. Under the plan, the administration would allow wind power projects to be built in federal waters off the coast of Morro Bay, as well as at a second location west of Humboldt Bay. This is important to all of us because the two areas combined could generate over 4,600 megawatts of electricity — enough to power 1.6 million California homes.
Gov. Newsom praised the plans and estimated it would be built at least 20 miles offshore with enough space for roughly 380 wind turbines. The announcement comes amid a surge of interest in offshore wind power, which European countries have been using successfully for more than a decade, but which the United States has been slow to adopt. Despite wind energy’s appeal — it produces no greenhouse gas emissions and has a minimal environmental footprint — it hasn’t made progress in California.
Although there has been no shortage of interest from wind farm developers in sites along California’s coast — particularly off the Central Coast and Humboldt Bay — efforts have been stymied. There has been regulatory obstacles, engineering challenges (created by the Pacific Ocean floor’s steep drop-off), and concerns about the impact the infra-structure could have on migratory birds, marine life and fisheries. As for the engineering challenges, the California coast presents an interesting problem.
Unlike federal waters off the East Coast, which are shallow enough to allow offshore wind infrastructure to be secured to the Atlantic seafloor, the Pacific Ocean is so deep that the only viable way to install offshore wind farms would be to build floating turbines that are tethered in place by cables. Floating offshore wind technology is still relatively new, but the industry has made significant progress in recent years. Nevertheless, it could be a decade before offshore wind farms start generating a significant amount of electricity. Any projects would need to undergo a thorough environmental review to study the potential consequences for fishing, shipping, marine life and views from the beach. They would also probably need the blessing of numerous state agencies.
WRITTEN BY:
For further information, comments, and questions:
Lloyd Segal
President
Los Angeles Real Estate Investors Club, LLC
www.LAREIC.com
[email protected]
310-409-8310
Learn live and in real-time with Realty411. Be sure to register for our next virtual and in-person events. For all the details, please visit Realty411Expo.com or our Eventbrite landing page, CLICK HERE.

