Inflation, Home Price Swings, and Wealth Distribution
|
Getting your Trinity Audio player ready...
|
By Rick Tobin
Between January 2020 and October 2021, the M1 money supply (cash or cash-like instruments) quickly rose from $4 trillion up to $20 trillion in just 22 months. Money velocity, or money creation speed, is the true root cause of rapidly declining purchasing power and skyrocketing inflation. The more money in circulation, the less purchasing power for the dollar.
article continues after advertisement

In January 2024, Americans were paying $213 per month more to purchase the same goods and services one year earlier in 2023 because of rising inflation and the declining purchasing power of the dollar. As compared with two years ago in 2022, Americans are paying $605 more per month. Sadly, we’re now paying $1,019 more PER MONTH ($12,228 more per year) today for the same goods and services we purchased three years ago in 2021.
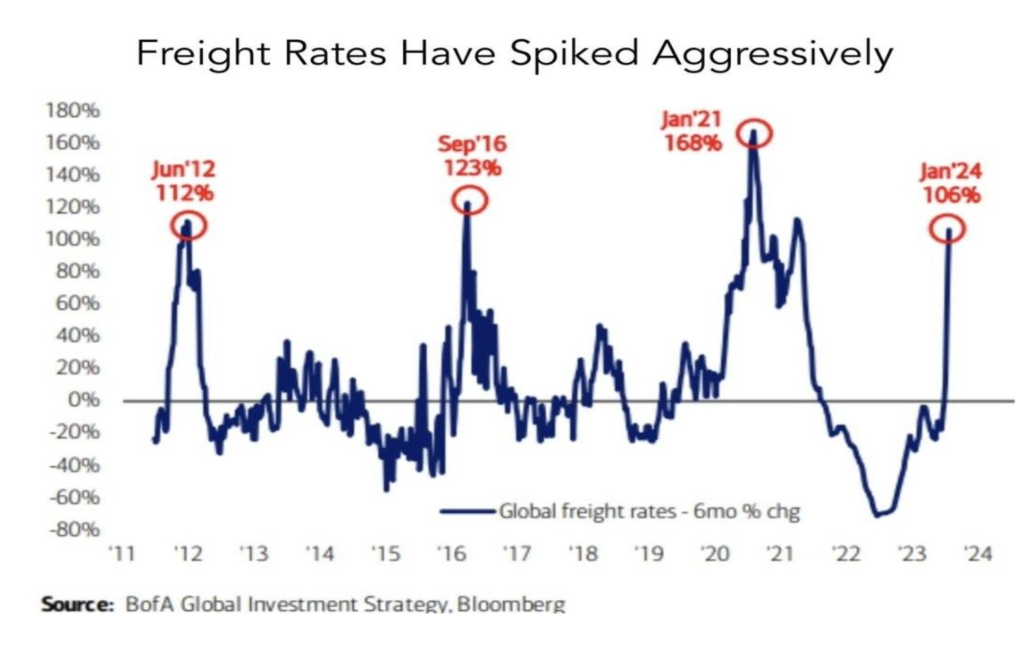
Shipping, trucking, and other transportation costs are quickly rising amid geopolitical tensions. Historically, increasing transportation and energy costs are a root cause of inflation trends. Don’t be surprised if inflation rates and interest rates are both higher later this year instead of lower.
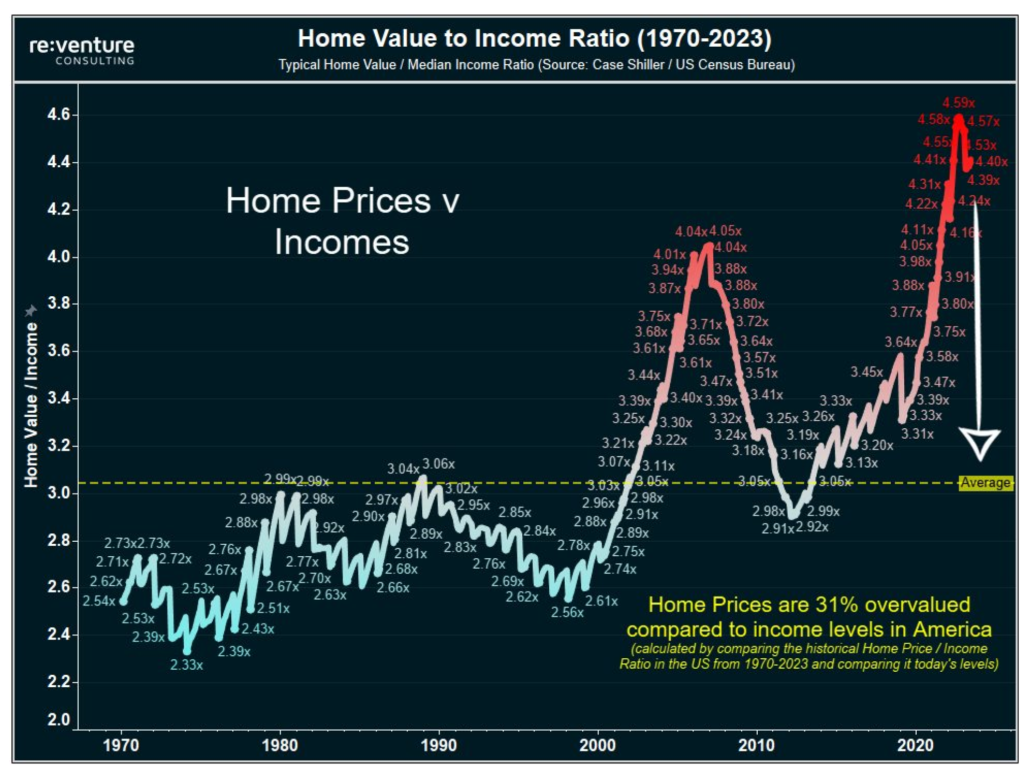
Home Value-to-Income Ratio in the U.S.
The U.S. home value-to-income ratio is calculated by dividing the $342,000 median home value by the $74,580 median household home, according to Economy Vision. If home prices had grown at the same rate as income since 2000, the median U.S. home would cost nearly $294,000, or 31% to 32% lower than today’s prices.
U.S. households need an average income of $166,600 to afford a home, but the median household income is $74,580. The lowest home price-to-income ratios in large metropolitan regions are in Pittsburgh (3.2x), Buffalo (3.5),and Cleveland (3.5), while many California regions are near 10 to 20x. Some smaller suburban or rural regions in Southern Illinois and other Midwest regions are closer to 1.5 to 1.8 for home price-to-income ratios.
Increasing Distressed Residential and Commercial Mortgage Numbers
Millions of Distressed Residential Mortgages
The federal government keeps extending the millions of distressed FHA and VA loans, or offering discounted loan modifications, partly so that they don’t push the national home listing supply skyward and reduce home prices at the same time.
The C-19 foreclosure or forbearance moratoriums for millions of FHA and VA borrowers began back in the fall of 2020. As a result, many of these home borrowers haven’t made a mortgage payment for more than three years.

The FHA forbearance moratoriums for FHA borrowers expired on November 30, 2023 while the VA forbearance moratoriums were extended until May 31, 2024. At some point, these loans will need to be brought back current, sold, or foreclosed.
In the previous housing crash that was especially bad during 2008 to 2012, only about 2% (or 1 in 50 mortgages) of all residential loans were delinquent. Yet, these distressed home mortgages became future lower value comps for the nearby homes while driving their prices downward too, sadly.
If and when the national home listing supply numbers rapidly increase this year, it will eventually have a negative impact on home price trends because it’s all supply-and-demand economics at the true core. When supply of a product or asset rises and exceeds buyer demand, then prices tend to fall (and vice versa).
Concerning Commercial Mortgage Trends
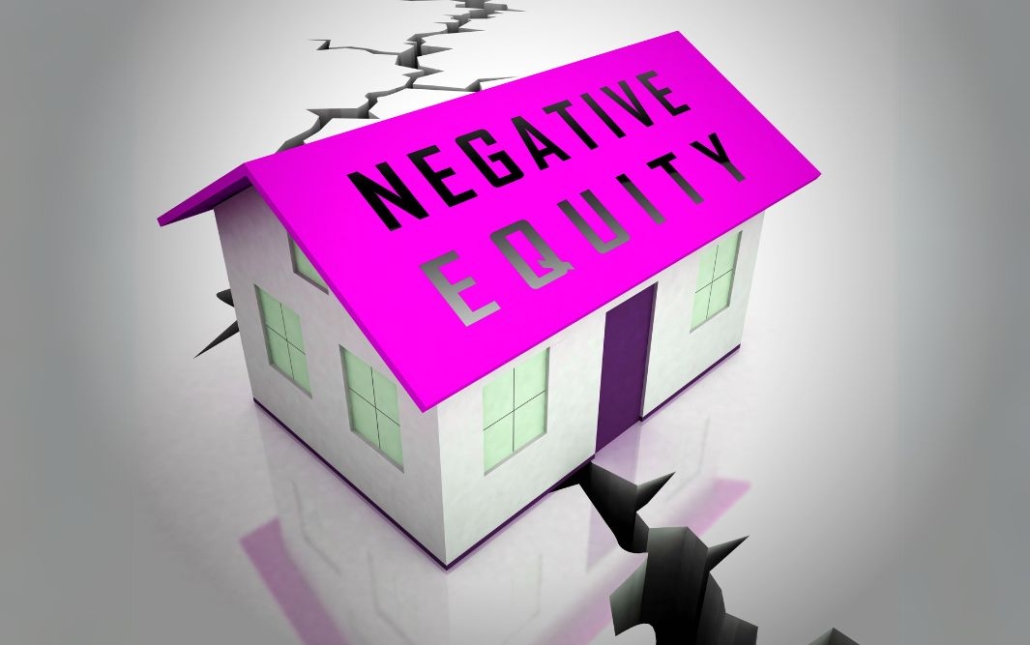
An estimated 44% of office buildings nationwide with mortgages in place are claimed to be upside-down with negative equity here near the start of 2024. Some office buildings are selling for as low as $9 per square foot, not $900/sq. Ft. By the end of 2024, the underwater office building numbers may be well over 50% and the overall underwater or upside-down numbers for all commercial property types may be somewhere within the 20% to 25% range.
Physical and Online Retail Store Numbers
- In Q3 2023, the amount of U.S. retail space available for lease plunged to an all-time low since the CoStar commercial real estate group started tracking back in 2007.
- The previous seven years in a row (2017 – 2023) shattered all-time retail space closings per square foot in U.S. history.
- Through just September 2023, 73 million square feet of retail space closed in 2023, as per Coresight.
- 140 million square feet of retail space has been demolished in the last decade, according to CoStar.
- Top 6 online sales percentages in 2023: 1. Amazon (37.6%); 2. Walmart (6.4%); 3. Apple (3.6%); 4. eBay (3%); and 5. Target and Home Depot (a tie at 1.9% each), per Statista.
- 10.4% of total annual U.S. retail sales were online in 2017;
- 12.2% of total annual retail sales were online in 2018;
- 13.8% of total annual retail sales were online in 2019;
- 17.8% of total annual retail sales were ecommerce in 2020;
- 18.9% of total annual retail sales were ecommerce in 2021; &
- 18.9% of total retail sales were online in 2022, per Statista.
- The full 2023 online year results weren’t published yet.
Record-High Car Payments

Some new monthly car payments are reaching $3,000 per month, while average new car payments are near $730 to $750 per month. Additionally, many monthly car insurance payments are reaching $400 to $500 per month in cities like Detroit and Philadelphia. How much are these car owners paying in gas and maintenance as well?
The national average cost for car insurance rose a whopping +26% from last year, according to Bankrate.
The most expensive cities for car insurance are:
Detroit – $5,687
Philadelphia – $4,753
Miami – $4,213
Tampa – $4,078
Las Vegas – $3,626
The cheapest cities are:
Seattle – $1,759
Portland – $1,976
Minneapolis – $2,044
Boston – $2,094
Washington D.C. – $2,430
The average car loan today is valued at 125% LTV (loan-to-value) for the typical car on the road with a loan with an average negative equity balance of -$6,000. This is partly because so many car buyers are purchasing cars with no money down and adding their registration, licensing, taxes, and warranty fees on top of it before driving off of the car lot. New cars usually drop in value about 20% in the very first year of purchase.
article continues after advertisement

Inflationary or Deflationary Economic Cycles
Inflation has been described as an increase in the general level of prices of a certain product in a specific type of currency. Inflation can be measured by taking a “basket of goods,” and then comparing them at different periods of time while adjusting the changes on an annualized basis.
General inflation measures the value of a currency within a certain nation’s borders, and refers to the rise in the general level of prices. Currency devaluation measures the value of currency fluctuations between different nations. Some related terms associated with inflation are as follows:
* Deflation is a rise in the purchasing power of money, and a corresponding lowering of prices for goods and services. The Fed doesn’t like this economic period of time and will probably cut short term rates to offset it.
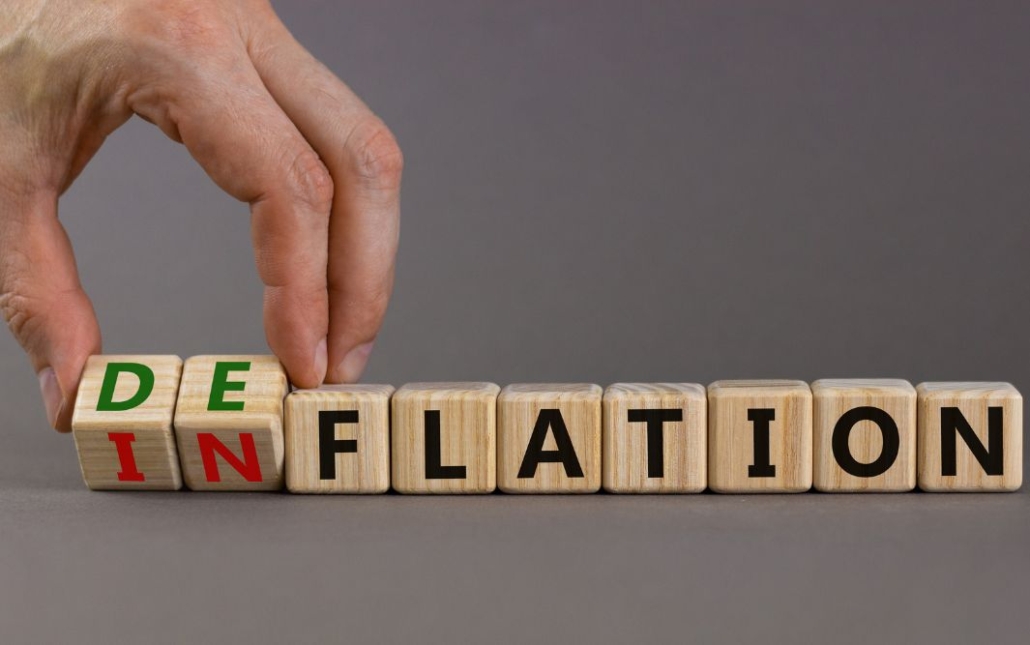
* Disinflation refers to the slowing rate of inflation. The Fed may like this type of economic time period, and may stop raising rates at this point in the economic cycle.
* Reflation is the period of time when inflation begins after a long period of deflation. Depending upon the severity of inflation, the Fed may pause the rate hikes or gradually begin rate hikes.
* Hyperinflation is rapid inflation without any tendency toward equilibrium. It is inflation which compounds and produces even more inflation. It is when inflation is much greater than consumers’ demand for goods and services. The Fed, and the rest of America, do not typically like this economic period, so they may enact a series of significant rate hikes to slow inflation.
The Wealth Distribution Imbalance

Wealth distribution across the U.S. has become increasingly concentrated in the hands of fewer people since 1990. Overall, the top 10% of wealthiest Americans own more than the bottom 90% combined, with more than $95 trillion in wealth for the top 10%.
Here in 2024, the share of wealth held by the richest 0.1% is near its peak with a minimum of $38 million in wealth in just 131,000 households.
With $20 trillion in wealth, the top 0.1% earn an average of $3.3 million in income each year. The greatest share of the wealth owned by the top 0.1% is held in corporate equities or stocks and in mutual funds, which make up over one-third of their total assets.
Households in the lower-middle and middle classes as found in the 50% to 90% income and asset brackets are claimed to have a minimum of $165,000 in wealth held primarily in real estate and followed by pension and retirement benefits.
Unless you’re in the Top 0.1%, the odds are quite high that the bulk of your wealth is concentrated in real estate if you’re fortunate enough to own at least one property today. In our next meeting, we will discuss how to find discounted real estate and other investments and how insurance and estate planning can help protect your assets for you and your family.
Extreme Rate Swings, Steady Home Gains

Between 2000 and 2023, the median U.S. home appreciated approximately 10.63% per year. By comparison, California homes rose 12.55% per year between 2000 and 2023.
Doubling Value Forecasts: The Rule of 72 is an investment formula used to estimate how long it may take for an asset to double in value using a projected annual rate of return (72/7 or 7% = 10+years).
A home purchased using the national average annual gain of 10.63% would double in value in just over 6.77 years if purchased this year (72/10.63 = 6.77 years). A California home would double in just 5.74 years (72/12.55) if these same average annual appreciation gains continued.
Home prices tend to go skyward following a Fed pivot when they start slashing rates. When will the Federal Reserve start cutting rates again? Let’s take a look at their calendar for 2024 two-day meeting dates: Jan. 30-31 (no rate change); March 19-20; April 30- May 1; June 11-12; July 30-31; Sept. 17-18; Nov. 6-7; & Dec. 17-18.
Inflation severely damages the purchasing power of the dollar while usually boosting real estate values. Because it’s more likely than not that inflation will continue rising above historical average trends, then real estate may be one of your best hedges against inflation as your wealth compounds and increases as well.
Rates may be lower, the same, or higher by the end of 2024, partly due to our volatile inflation movement and weakening dollar. However, there’s a tremendous upside for real estate investors if you’re willing to stay focused on the opportunities and not let the negative news scare you away.

Rick Tobin
Rick Tobin has worked in the real estate, financial, investment, and writing fields for the past 30+ years. He’s held eight (8) different real estate, securities, and mortgage brokerage licenses to date and is a graduate of the University of Southern California. He provides creative residential and commercial mortgage solutions for clients across the nation. He’s also written college textbooks and real estate licensing courses in most states for the two largest real estate publishers in the nation; the oldest real estate school in California; and the first online real estate school in California. Please visit his website at Realloans.com for financing options and his new investment group at So-Cal Real Estate Investors for more details.
Learn live and in real-time with Realty411. Be sure to register for our next virtual and in-person events. For all the details, please visit Realty411.com or our Eventbrite landing page, CLICK HERE.


