How Can Someone With Bad Credit Obtain a Hard Money Bridge Loan?

By Michael Mikhail 

You only have the traditional institutions (banks), mortgage companies, and direct private money lenders as possibilities if you’re a borrower seeking for finance for your investment property.

However, many of the conventional finance sources would not be good choices if you are a real estate investor with poor credit. The majority of banks and mortgage firms don’t have mortgage loan programs for those with bad credit. Fortunately, a Hard Money Bridge Loan is a wonderful choice to get funds and even raise your credit score in the world of private money lenders.


ADVERTISEMENT


There are so many loans available, and a lot of them substantially factor a person’s credit score into whether or not they will grant them a loan. Thankfully, Hard Money Loans are an exception to this rule.

What conditions must be met to qualify for a hard money bridge loan?

The criteria for a hard money loan are your assets, not your FICO score. There is no required minimum FICO score for the borrower, but you must still furnish your credit score. Hard money lenders instead concentrate on the asset’s Loan-to-Value (LTV). There is no need to be concerned about bankruptcies, foreclosures, collections, etc. because there isn’t any underwriting involved in these loans either. They are typically limited to 75% LTV or below, with rates between 9.00% and 11.99%, and are always bridge loans for 12 to 24 months. True hard money loans never come with terms.

As was already mentioned, the emphasis is on equity and assets rather than credit. If there is enough equity in the property and the applicant can repay the loan, it may be possible to overlook the borrower’s terrible credit, prior bankruptcies and foreclosures. The property’s value is given additional attention. In comparison to typical loans, the financial checks for these loans are less thorough and take less time. Hard money lenders are exempt from many of the regulations that more conventional bank loan lenders must follow. As a result, a Hard Money Bridge Loan can be authorized considerably more quickly. Stratton Equities, the top Nationwide Direct Hard Money and NON-QM Lender, may fund a Hard Money Loan in as little as two weeks, when a standard bank loan might take 45–90 days.

There is more risk being assumed by the lender because of the short turnaround time and less stringent surface-level financial standards. Therefore, compared to regular loans, the repayment terms are much shorter. A Hard Money Bridge Loan must be repaid in a matter of years, as opposed to a standard loan, which may have a repayment period of around 20 to 30 years. Therefore, if a borrower has poor credit, the lender is taking a bigger risk and needs the money repaid faster.

How Can a Private Lender Improve Your Credit Score?

A real Hard Money Bridge Loan does not have a minimum credit score requirement and can even raise your score, in contrast to a term loan, which calls for a minimum credit score of 650.

If you are a real estate investor and you have a substantial amount of equity in your investment property (more than 50%), you may be able to use a hard money bridge loan to withdraw the funds and use them to settle debts or repair your credit.

Return to the private money lender and submit an application for a term loan after your credit score is more than 650. (ex. no documentation loan).

How can you submit a Bridge Loan application?

Due to predatory lending and expensive rules, hard money bridge loans are only permitted for investment properties. You cannot obtain a Hard Money Bridge Loan if you are shopping for an owner-occupied property.

Due to the substantial risks, some states have non-judicial foreclosure legislation as well. Due to the protection provided by these laws, lenders feel more secure providing these high-risk loans because they are not traded on the secondary market and the lender keeps the note. Additionally, rural communities are not eligible for these loans if they have poor FICO ratings.

If you have poor credit, get in touch with Stratton Equities to find out your available loan alternatives and which one will suit you the most.

Our goal at Stratton Equities is to make private mortgage lending simple, effective, and stress-free. With a straightforward three-step process that includes pre-approval, processing & underwriting, and funding, we assist other seasoned investors, borrowers, and experts in the mortgage and real estate industries in succeeding.

To find out if you qualify for loan pre-qualification, call us at 800-962-6613, send us an email at [email protected], or submit an application right away by clicking here!


ADVERTISEMENT


Michael Mikhail, CEO Stratton Equities

Michael Mikhail is the Founder and CEO of Stratton Equities, the nation’s leading hard money-lender to national real estate investors, with the largest variety of mortgage loans and programs nationwide.

Having launched Stratton Equities in early 2017, Michael has always been an entrepreneur and innovator in the real estate market, purchasing his first home at 19.

A serial entrepreneur with a foresight for business opportunities, Michael had a slew of small businesses prior to launching Stratton Equities. One of his most prolific ventures was a car wash connected to a gym he was affiliated with in Florida during 2001-2002 while attending college.

It wasn’t until he graduated from Florida State University with a degree in Business, that he officially joined the mortgage industry in 2003 and decided to travel to explore his options globally.

After travelling to 19 countries in 5 years, Michael knew two things; he wanted to start his own business and launch it in the United States. He knew that moving back to the states was the best place he could start something small and grow it into something infinite.

In 2017, Michael noticed how the mortgage industry had transformed after the regulations presented from 2008-2012, and knew it was time to set out something on his own, thus creating Stratton Equities.

Under Michael’s leadership, Stratton Equities has grown into one of the biggest leaders in the Mortgage and Real Estate industry across genres and platforms.


Learn live and in real-time with Realty411. Be sure to register for our next virtual and in-person events. For all the details, please visit Realty411Expo.com or our Eventbrite landing page, CLICK HERE.

A 33-to-1 Vacant & Distressed Home-to-Listed Home Ratio

By Rick Tobin

Why are you just searching for listed properties for sale when the number of distressed, vacant, and “shadow inventory” homes is almost 33 times larger than the national home listing inventory supply?

How is this possible with my 33 number claim? First, upwards of 16 million homes were listed as “vacant” or shadow inventory in the fourth quarter of 2022, as per the U.S. Census Bureau, National Association of Realtors (NAR), and other groups. A vacant home can be defined as a vacation home, unsold new home building inventory (near record levels of new single-family homes and multifamily apartment buildings being built in 2023), distressed or pre-foreclosure properties, or homes held by billion-dollar corporations like BlackRock, Blackstone, or State Street for the long-term that just sit there with no intent to rent it out at present.

Second, there are at least a few million distressed mortgages (FHA loans, especially) currently in forbearance agreements in order to delay the lender’s foreclosure filing actions to bring the total to more than 18.5 million properties. Frankly, I think that the number is closer to 20 million after counting VA, conforming, non-QM, and private money loans, but we’ll just focus on the 18.5 million vacant or distressed home number.

Since 1934, FHA (Federal Housing Administration) has insured more than 40 million loans nationwide. Today, a relatively high percentage of homebuyers still rely upon FHA to purchase their homes partly due to the much lower interest rates and easier loan qualification guidelines such as loan programs which allow FICO credit scores as low as 500, debt-to-income (DTI) ratios up to 50% or higher, and loan-to-value (LTV) options near 96.5% to 100% LTV.

As of March 2023, the national home listing inventory was listed at 562,565 by data provided by the Federal Reserve Economic Data and the NAR. Let’s do the math as follows:

18.5 million distressed or vacant homes / 562,565 listed homes = 32.885 times


ADVERTISEMENT


Distressed FHA Loans & Continued Forbearance Extensions

There are three to four times as many delinquent FHA mortgage loans nationwide as compared to the entire national home listing inventory with somewhere near at least a few million distressed FHA loans.

February 8, 2023: Today, the U.S. Department of Housing and Urban Development (HUD) Secretary Marcia L. Fudge announced that, thanks to Federal Housing Administration (FHA) programs, approximately 2 million homeowners with FHA mortgages were able to stay in their homes from the beginning of the COVID-19 pandemic in March 2020 through December 2022 – when doing so was often a matter of life and death. During this period of time amid the pandemic, FHA borrowers whose ability to make their mortgage payments was impaired by the pandemic were able to obtain either a COVID-19 forbearance or a more permanent solution such as a loan modification that allowed them to avoid foreclosure.
Source: HUD Secretary Announces Major Milestone of Assisting Nearly 2 Million Homeowners Stay in their Homes

With a few million distressed FHA loans that they admit to and is probably undercounted, it’s no wonder why the federal government wants to keep offering FHA forbearance extensions.

Details of FHA’s COVID-19 Forbearance

Important information about FHA’s COVID-19 Forbearance:

To be eligible for the COVID-19 Forbearance or forbearance extension in the table above, you must request this relief from your servicer on or before May 31, 2023.

You can request a FHA COVID-19 Forbearance for up to 6 months. If needed, an additional 6 month extension may be requested. If you began your initial forbearance on or after October 1, 2021, you are only eligible for the additional 6 months if your initial 6 months forbearance will be exhausted and expires on or before May 31, 2023.

Additional forbearance options may be available to you after May 31, 2023. Your mortgage servicer may provide for a temporary pause or reduce your monthly mortgage payments to allow you time to overcome your financial hardship. An extended forbearance period may be provided to you if you are unemployed and actively seeking employment.

No extra fees, penalties, or interest will be added to your account during the forbearance period.

Source: U.S. Department of Housing and Urban Development (HUD)

There are also a significant number of distressed VA and conforming or conventional loans nationwide which are held by Fannie Mae or Freddie Mac in the secondary market that aren’t really being “officially” counted with the most up to date numbers. FHA and VA mortgage loans have both consistently represented close to 10% each of the annual national funded loan market. As a result, these government-backed or insured loans, which typically average close to 0% to 3.5% down payments for FHA, VA, and conforming, are something to keep a close eye on as the economy continues to soften.

The 40-Year Loan Modification Program for FHA Borrowers

Good news: National mortgage delinquency rates dropped 15% in March 2023 while reaching 2.92%, which was a new all-time record low.

Bad news: Millions of distressed mortgages are not being counted as “delinquent” once they enter forbearance agreements with their lender (FHA loans, especially). The national FHA loan default rate reached 12% in February and will likely continue to rapidly increase. Distressed FHA and VA loan investments are some of the best deals out there because they usually have the lowest mortgage rates that you can take over by way of creative seller-financing techniques.

A forbearance agreement is when the lender or mortgage loan servicing company agrees to postpone or delay their foreclosure actions with the delinquent borrower. Sometimes, these foreclosure postponements may last months or years.

On March 8, 2023, HUD issued their Mortgagee Letter 2023-06 with details described as the “Establishment of the 40-Year Loan Modification Loss Mitigation Option” with a stated purpose noted as “This Mortgagee Letter (ML) establishes the 40-year standalone Loan Modification into FHA COVID-19 Loss Mitigation policies.”

Several mainstream media analysts mistakenly described this new 40-year loan proposal offered by FHA as a purchase loan as well. Yet, this is not correct because it’s only for the refinance of currently distressed 30-year FHA loans into longer 40-year loan terms in order to reduce the monthly payments for borrowers. There is no published word about whether FHA will later consider offering 40-year purchase loans for borrower prospects.

Housing and Family Trends

Real estate is a people business, first and foremost. The #1 most important factor for housing trends is related to population trends and household formations for families especially. Without people, there’s no need for housing regardless of the affordable financing offered.

One of the main reasons why people purchase single-family homes is because they’re trying to either build a growing family or the need to house two or three generations of the family under the same roof. You can’t spell “single-family homes” without family in it.

The U.S. has the highest percentage of one-person households in the entire world. A few years ago, one-person households surpassed all other household formations in Canada.

In 2022, only 24% of U.S. households had at least one child under the age of 18. In 1965, upwards of 42% of households had a child under the age of 18.

The Decline of Family Households

Here are some of the published data numbers from sources such as the U.S. Census Bureau, the National Center for Health Statistics (NCHS), Pew Research, and numerous other data sources in regard to individuals and family structure trends:

  • National overall divorce rate in the USA: 50%+.
  • The California divorce rate is 60%.
  • The Orange County, California divorce rate is 72%.
  • 41% of first marriages nationwide end in divorce.
  • 60% of second marriages end in divorce.
  • 73% of third marriages end in divorce.
  • The average length of a marriage in the U.S. that ends in divorce is 8 years.
  • There is one divorce every 36 seconds in the U.S. on average; 2,400 divorces per day; 16,800 divorces per week; and 800,000 to 900,000 divorces per year.
  • The percentage of American men between the ages of 20 and 39 who are now married has fallen by half (35% of men are married as of 2017) since the early 1970s (70% of men were married).
  • Unmarried parents who live together are more likely to break up than married parents, per the Brookings Institute.
  • Per the CDC in 2016 through at least 2020, U.S. fertility rates were the lowest ever recorded as fewer couples are having children these days. Each consecutive year over the past five or six years reached all-time record lows.
  • 78% of all households in the U.S. contained one married couple in 1950. Today, married households are below 48%.
  • In 2010, the Pew Research Center reported that 44% of Americans polled in the 18-to-29 year old age range believed that “marriage was becoming obsolete.”
  • Divorce rates for people over the age of 50 have doubled between 1990 and 2015, per Pew Research Center.
  • In 1956, roughly 5% of all babies were born to unwed mothers. Between 2008 and 2016, babies born to unwed mothers were closer to the 40% range.
  • Upwards of 50% of children in impoverished regions of the U.S. live in homes without fathers.
  • 46% of children live at home with a mother and father who were in their first marriage together.
  • The average American woman in 1970 had her first child at 21.4 years of age. Today, the woman is near 25.6 years of age.
  • The U.S. has the highest teen pregnancy rate in the industrialized world.
  • More than 50% of children are born to unmarried women under the age of 30.

Saving Equity or Creating Newfound Wealth

What are your options as either a homeowner with an ongoing forbearance agreement in place with your lender, a struggling business owner, a commercial property owner and landlord with incredibly high vacancy rates, or as an investor seeking new opportunities if and when the economy suddenly pivots and we enter a more clearly visible deeper recession? If home values are more likely to be higher today than later this year, is it now a good time to sell? If so, where will be your next destination for a home?

Generally, loss of income is the #1 reason why homeowners lose their homes to lenders or mortgage loan service companies in foreclosure. The #2 reason why homeowners walk away from their home is when the mortgage debt exceeds the current market value and it’s upside-down or underwater. This is when short sale options become more prevalent.


ADVERTISEMENT


The real risk associated with homes purchased in recent years is related to the relatively low down payment averages for first-time buyers and others that were leveraged between 96.5% and 100% loan-to-value at the close of escrow. Effectively, these homebuyers were upside-down with negative equity at closing when factoring in the potential 6% to 8% closing costs to resell the homes after paying real estate brokerage commissions, title, escrow or attorney’s fees, transfer taxes, third-party inspection reports, and possible seller credits towards the buyer’s closing costs.

In 2022, first-time homebuyers represented 34% of all home purchases across the nation, as per the NAR. During the fourth quarter of 2022, purchase loans comprised 78.6% of all FHA mortgages funded. With a high percentage of FHA borrowers reported as first-time homebuyers, their average down payments were likely close to 3.5% or below. What happens if home values fall 5%, 10%, or more in value over the next year?

If you’re currently in a distressed mortgage situation as a homeowner or investor or are searching for discounted off-market listings as a buyer with very creative and flexible financing solutions, I can show you effective ways to save your equity or create newfound wealth with my mortgage and investment business named Realloans (Real Estate Loans and Creative Sales) and my real estate group linked here: So-Cal Real Estate Investors.


Rick Tobin

Rick Tobin has worked in the real estate, financial, investment, and writing fields for the past 30+ years. He’s held eight (8) different real estate, securities, and mortgage brokerage licenses to date and is a graduate of the University of Southern California. He provides creative residential and commercial mortgage solutions for clients across the nation. He’s also written college textbooks and real estate licensing courses in most states for the two largest real estate publishers in the nation; the oldest real estate school in California; and the first online real estate school in California. Please visit his website at Realloans.com for financing options and his new investment group at So-Cal Real Estate Investors for more details. 


Learn live and in real-time with Realty411. Be sure to register for our next virtual and in-person events. For all the details, please visit Realty411.com or our Eventbrite landing page, CLICK HERE.

Economic Extremes & Consumer Shock

By Rick Tobin

None of us have ever seen such wide-ranging extremes of economic and asset trends as we’ve seen over the past few years. In many ways, it’s like we’re on a giant yo-yo swinging wildly from side to side or on a bumpy roller coaster ride with wicked twists and turns that keeps moving onward for years at a time instead of over just a minute or two.

All of the economic jerking that we feel on a daily basis can be overwhelming. Some days we see very positive news which gives us hope for a bright future. Other days, the gloomy negative news can seem a bit shocking because much of these positive and negative economic data trends have never been experienced in past years or decades.

Let’s review some of the key economic data trends that swing from very bad to very good (or vice versa) in hours, days, weeks, months, or over the past few years:


ADVERTISEMENT


Home Price Changes

Nationally, home prices have risen consistently since 2011. Investor home purchases fell the most on record in the 4th quarter of 2022 at a whopping -46% decline pace. Home prices fell for six months in a row since peaking in July 2022 through the end of January 2023, according to the Case-Shiller U.S. National Home Price Index.

A booming home price example: A young family purchases a new starter home for $300,000 in January 2020 shortly before the global pandemic designation. That same home would’ve peaked at $435,000 in the summer of 2022 using the same Case-Shiller data trends. If so, the family gained $135,000 in newfound equity in just 18 months or so.

The most horrific housing crash in US history took place between the market peak in 2006 and 2012 when the national housing average fell – 27%. California’s home losses were much more extreme with the peak to trough bubble burst falling as much as -41%.

Between 2019 and peak prices near the summer of 2022, many regions had home appreciation percentages of somewhere between massive 50% and 100%+ gains. Future home losses will need to be significant and the worst ever in national history to turn recent home purchases negative.

For people who’ve owned their homes for many years or decades, they will be more likely to ride out any significant price drops in the future. However, buyers who purchased with anywhere between 0% and 5% down in recent years may soon go underwater with the mortgage debt surpassing the market value.

Year-over-year home sales fell between 37% and 47% in Southern California counties through January. As sales volume declines, home price drops tend to follow even if most sellers aren’t willing to do it at first because they want peak record high prices like last seen in 2022.

Fewer buyers means less competition for quality properties and may lead to home listing price cuts and increased closing cost credits from sellers to buyers.

Commercial real estate properties: Upwards of 50% of all commercial property mortgage debt is a floating or adjustable rate. Additionally, the cost to insure the interest rate cap derivatives contract that protects both borrowers and lenders from the increasing risks associated with rising rates has increased 10-fold for borrowers, as per the Wall Street Journal. As such, it’s a double whammy for commercial mortgage borrowers in that both their mortgage and insurance rates have skyrocketed over the past year. The commercial sector is still getting hit harder than residential.

Listing Supply

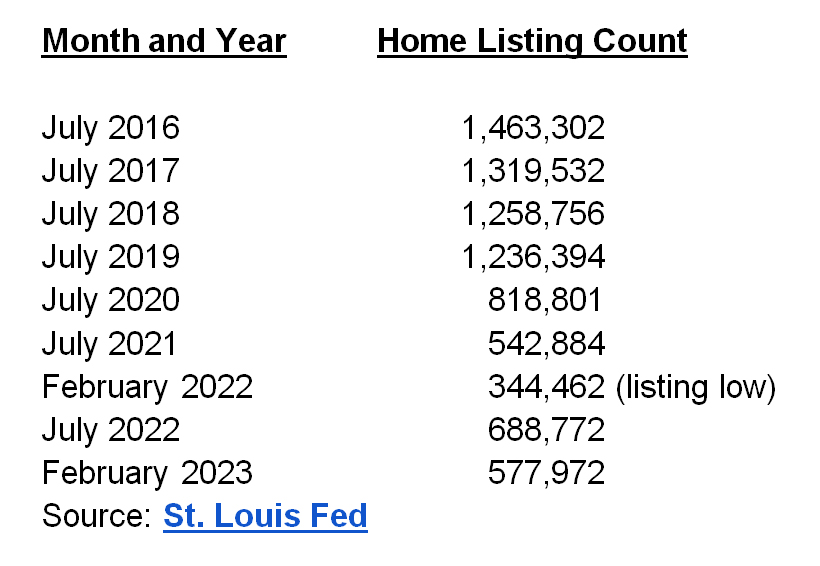
The St. Louis Fed and Realtor.com share data together which shows both the current and past history for single-family homes, townhomes, and condominiums across the nation at any given time. As with other products available for purchase, a lower supply of something like eggs or popular toys will likely lead to higher prices due to the demand exceeding the available supply. Conversely, an oversupply of a product and falling demand will cause prices to fall.

Let’s review the national home listing trends dating back to 2016:

The US Census Bureau recently published data for the 4th quarter of 2022 which showed that there were 15 million vacant housing units (homes, condos, and rental apartments).

Vacant “shadow inventory” homes that are NOT listed for sale absolutely dwarf the total number of listed homes nationwide by a significant multitude. This has been true since at least 2009. If just 5% or 10% of the “shadow inventory” homes suddenly changed to homes available for sale, it could double the size of the national listing supply. “Shadow inventory” homes can also include homes already foreclosed upon by banks or mortgage loan servicing companies that are not offered up for sale.

Mortgage Rates

Approximately 75% of all homes nationwide were purchased with mortgages in recent years. Almost every boom and bust housing cycle over the past 50+ years was directly related to mortgage rate trends.

Between April 1971 and September 2022, the average 30-year fixed mortgage rate was 7.76% as per Freddie Mac. Today’s rates for borrowers with average FICO scores near 690 have fluctuated between 7% and 8% in recent months. The main difference today is that mortgage balances are two, three, four, or five times larger than in decades past.

We’re in the midst of the fastest mortgage rate increase in US history. The Federal Reserve’s rate hikes at a record pace over the past year are likely to later pivot and become massive rate cuts at some point in the future like we saw shortly after the 2008 housing bubble burst.

For comparison purposes about rate hikes, the Fed increased rates 17 times between June 2004 and June 2006 while pushing rates from 1% to 5.25% over 24 months while much smaller rate hikes that were closer to .25% at a time. This was the catalyst for the housing bubble burst later as so many adjustable rate option-like pay ARM mortgages and HELOCs doubled or tripled in monthly payment amounts.

Between the 1st quarter of 2022 and the 1st quarter of 2023, we’re on pace to increase rates 4.25% just like during the 2004 to 2006 era while doing it in about half the time (12 months instead of 24 months).

As of July 2022, approximately 80% of all open residential mortgages nationwide were priced at a fixed 4% rate or lower as per CoreLogic. Approximately 40% of all US residential mortgages were financed or refinanced near peak lows in 2020 or 2021.

Key point: The Primary Mortgage Market Survey conducted by Freddie Mac found that 99% of all residential mortgages nationwide had existing fixed rates lower than the national fixed rate average during the first week of March 2023.


ADVERTISEMENT


Three years ago near the start of the “pandemic” declaration in March 2020, the 10-year Treasury yield hovered close to an incredibly low and rather spooky 0.666% yield. The 30-year fixed mortgage rate is tied to the directions of the 10-year Treasury yield. Today’s 10-year Treasury yield closed at 3.966% on March 6, 2023 by comparison, which was about 3.3% higher.

Historically, the 30-year mortgage rate pricing is about 1.7% over the 10-year Treasury yield (0.6630 + 1.7% margin = 2.363% 30-year fixed mortgage rate, approximately). Over the past year, the margin has widened considerably to 3% or 4% over and above the 10-year Treasury yield to arrive at the latest 30-year fixed mortgage. This widening of the margin was partly due to perceived worsening financial conditions and the Fed’s Quantitative Tapering strategies which included their attempt to sell off trillions of dollars’ worth of mortgage bonds in spite of their being few buyers.

As a result, the 30-year fixed mortgage rate skyrocketed faster than ever to reach somewhere between 6% and 8%, depending upon the borrower’s FICO score and other creditworthiness guidelines.

Mortgage Applications

The lowest mortgage application reading of the 21st century was reached as of the 1st quarter in 2023 due to rising rates. By comparison when mortgage rates were at or near all-time record lows, there were 23.3 million home loan applications completed by consumers, according to the Consumer Financial Protection Bureau.

M1 and M2 Money Supply

“M1 is the money supply that is composed of currency, demand deposits, other liquid deposits—which includes savings deposits. M1 includes the most liquid portions of the money supply because it contains currency and assets that either are or can be quickly converted to cash. However, “near money” and “near, near money,” which fall under M2 and M3, cannot be converted to currency as quickly.” – Investopedia

The federal government has not published data about M3 since 2006. Our national money supply trends are more of a factor for causing rising inflation or falling deflationary trends more so than consumer spending.

High

The M1 money supply from $4 trillion to $20 trillion between just January 2020 and October 2021.

Low

M2 is a measure of the money supply which includes cash, checking deposits, and other types of deposits that are easily convertible to cash such as CDs. Last year was the first time when bank deposits declined within the same year since 1948. This is partly why banks are finally starting to offer higher savings rates to attract more deposits because they’re running low on cash.

The M2 year-over-year growth swung from one extreme to another between 2020 and 2023. It peaked at a +26% year-over-year growth in 2021 and later collapsed to a -2% by early 2023. In the past, a negative M2 money supply that was contracting was a foreboding or ominous sign of an upcoming economic recession or severe depression like seen back in the 1920s.

The M1 and/or M2 money supply directional trends tend to mirror inflation or deflation trends. The more money that is created, the more likely that inflation will rise as well while pushing assets like stocks and real estate much higher. Conversely, a falling money supply can create a deflationary economic cycle when asset prices fall as well.

Savings: US savings rates reached an all-time record low by the 1st quarter of 2023.

Stocks

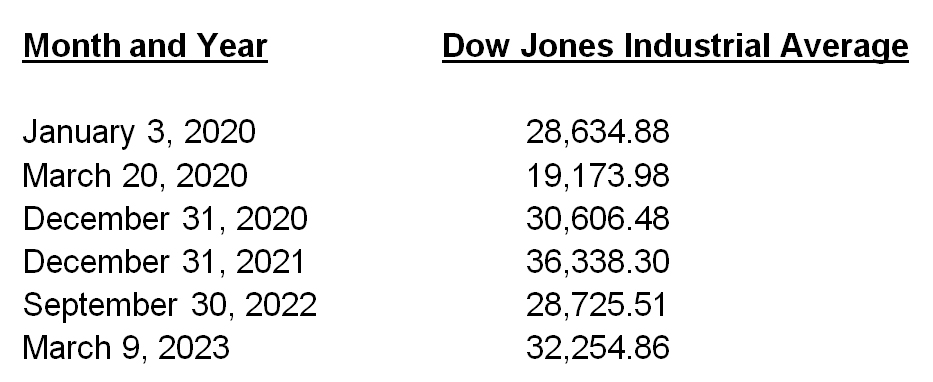
Let’s take a closer look at some key dates for the Dow Jones stock index to get a better understanding of how wildly stock prices have swung over the past three years:

The Dow Jones stock index fell from a peak high of 29,551.42 on February 12th to a market low of 18,213.65 on March 23rd in 2020, which is more than a 38% overall percentage loss in just over a month. Of the 10 all-time biggest daily point losses ever for the Dow Jones index, eight of these days took place in either February or March in 2020. By comparison, the then all-time daily Dow Jones point loss record for the infamous day that almost took down the global financial system back on September 29, 2008 was only a -777 daily point loss.

Month & Year / Daily Point Loss

#1: 03/16/2020 / -2997
#2: 03/12/2020 / -2353
#3: 03/09/2020 / -2014
#4: 03/11/2020 / -1465
#5: 02/27/2020 / -1191
#6: 02/05/2018 / -1175
#7: 02/08/2018 / -1033
#8: 02/24/2020 / -1032
#9: 03/05/2020 / -970
#10: 03/27/2020 / -915
Source: Standard and Poors (through 03/27/2020)

Consumer Debt

Mortgage and other consumer debt is at an all-time record high. Credit card debt is near $1 trillion with the highest rates and fees ever averaging over 20%.

Distressed or pre-foreclosure numbers are listed as “below historical averages” today partly due to existing Covid-19 moratoriums. However, the true number of distressed properties that do not have foreclosure filings may later be on pace to reach peak 2008 to 2012 numbers and will likely be led by FHA mortgage defaults (95% to 96.5% LTV is the norm for FHA purchase deals).

After loss of income, the #1 reason why homeowners walk away from their mortgage and let the property go to foreclosure is when it’s upside-down, underwater, or the mortgage debt is higher than the current market value.

The #1 cause of financial insolvency or bankruptcy is related to unpaid medical bills; Americans have never been unhealthier than today, tragically.

Published inflation rates have varied between 6% and 9% in recent months. Yet, the true inflation numbers are closer to 15% to 17% if the federal government used the same data analysis techniques as a few decades ago.

Subprime automobile loans recently surpassed 6%, which is the highest default number ever.

Energy Price Swings

Back in April 2020, oil prices per barrel briefly went negative to reach -37 per oil barrel. As a result, the cost of the barrel itself was more valuable than the oil inside. Energy costs are usually a root cause of both inflation and deflation as we’ve all seen over the past few years. Some oil barrel prices later surpassed $100 in 2022 as many of us saw $5, $6, $7, $8, and $9 per gallon, especially here in California.

Derivatives

At the peak of the last housing bubble burst in 2007 and 2008, the estimated value of the global derivatives marketplace was about $1,500 trillion. Today, the global derivatives market is closer to $3,000 trillion and may reach closer to $4,000 trillion by 2027 if the same annual growth rates continue, as per Globe Newswire. The frozen global derivatives market was the main cause of the Credit Crisis or Great Recession back in 2008.

A derivative is a hybrid financial and insurance instrument that can be leveraged up to 50 times. Or, it’s a glorified bet on the future direction of things like interest rate directional trends as seen with interest rate option derivatives. Even though us mortgage brokers and real estate investors were blamed by the media for the Credit Crisis, defaulted subprime mortgage debt represented less than 1% of all debt that imploded back then.

Denial or Research – Pick Your Poison or Solution

What we avoid in life controls us. It’s usually best to research as many different positive, neutral, or negative sides to any story or asset class like real estate. You’re more likely to survive any economic downturn if you make precautionary plans and keep your eyes wide open for new opportunities that few others around you can see at the time.

Denial is usually the most common first reaction when presented with dissenting opinions or scary topics, especially if you work or invest in the real estate or financial sectors. Yet, you must thoroughly analyze all sides, question everything (especially your own perspectives), and focus on the potential opportunities or solutions.

The harder we fall, the higher we bounce back, hopefully. If the Federal Reserve does a massive pivot and starts cutting rates again and increasing their Quantitative Easing strategies with more asset purchases (stocks, bonds, and mortgages) to boost the economy again, the market may do another positive market swing skyward. Only time will tell, so get your popcorn ready!


Rick Tobin

Rick Tobin has worked in the real estate, financial, investment, and writing fields for the past 30+ years. He’s held eight (8) different real estate, securities, and mortgage brokerage licenses to date and is a graduate of the University of Southern California. He provides creative residential and commercial mortgage solutions for clients across the nation. He’s also written college textbooks and real estate licensing courses in most states for the two largest real estate publishers in the nation; the oldest real estate school in California; and the first online real estate school in California. Please visit his website at Realloans.com for financing options and his new investment group at So-Cal Real Estate Investors for more details. 


Learn live and in real-time with Realty411. Be sure to register for our next virtual and in-person events. For all the details, please visit Realty411.com or our Eventbrite landing page, CLICK HERE.

Distressed Properties & Contradictory Data

By Rick Tobin

The published economic numbers that we see daily or weekly don’t necessarily reflect the reality of what’s going on with the job market, financial markets, and housing sector, especially. Reality can be a bitter pill to swallow, figuratively. Is our economy still booming, starting to soften or flatten, or is it turning negative?

The mainstream media likes to share economic data that’s published by the federal government which seems completely disconnected from reality. While we see articles published weekly about massive layouts from well-known companies like Amazon, Walmart, Disney, PayPal, Zoom, Dell, IBM, Microsoft, Google, Salesforce, Vimeo, Coinbase, and Goldman Sachs, we also see published unemployment data that’s claimed to be near historical lows. These massive layoffs and “near historical low unemployment” numbers seem to be contradictory to one another as they can’t both be true at the same time.


ADVERTISEMENT


What about housing? In early 2023, we are still seeing all-time record highs for median rents and median home prices in most regions of the country. Yet, we’ve also seen mortgage rates increase by two or three times above peak lows as last seen in late 2021 and the 1st quarter of 2022.

Generally, the booming or busting housing markets are tied directly to mortgage rate trends and whether or not loan underwriting is easing or tightening. How can property values still be peaking while we’ve also possibly seen the fastest increase with short-term and long-term rates in US history at the exact same time? This is another fine example of a contradictory marketplace with two extreme opposites at the same time.

Bubble Burst and Suppressed Housing Supply

For many of us, the absolute worst housing market bubble burst that we experienced firsthand was back in 2008. In California and many other states, the housing market started to peak in late 2006 or 2007. The catalyst for this peaking housing market bubble burst was directly related to the Federal Reserve’s aggressive rate hike campaign over the period of 24 months between June 2004 and June 2006. The Fed raised rates a total of 4.25% from 1% to 5.25% with 17 separate rate hikes.

Because so many borrowers were in adjustable rate mortgages or home equity lines of credit, the mortgage payments began to double or triple for property owners after these 17 rate hikes. As a result, the number of distressed or foreclosure properties reached several million with a high percentage located in California and other Sun Belt states like Nevada, Arizona, and Florida.

Let’s take a look at the worst bubble burst year ever in US history to better understand how bad the price collapse was in 2008:

● Home prices fell in 35 states.
● California had the biggest price collapse at -29.6%.
● Nevada had the 2nd biggest price drop at -22.8%.
● Arizona fell -19%, Florida dropped -18.2%, and Rhode Island fell -13.7%.


ADVERTISEMENT


Even worse, California home prices fell a total of -42% off their previous bubble peak. Nevada’s median price dropped -39% from their peak. Both Arizona and Florida fell -33% from their respective previous market peaks.

Because the number of distressed properties increased so dramatically, a very high number of lenders did not start the foreclosure process even if the borrowers were several years behind on their mortgage payments. If a lender or mortgage loan servicer did initiate the foreclosure and take it all the way to the final auction sale, millions of these properties were not placed up for sale as they became a massive shadow inventory of unoccupied homes.

Many lenders did not want to acknowledge or share how bad their non-performing loan portfolio was at the time with their stockholders, equity partners, or derivatives investors. If the lenders did foreclosure on every delinquent mortgage in their portfolio, it might financially crush the same lender. As a result, it wasn’t unheard of to read about homeowners in Beverly Hills mansions with $5 million loans who hadn’t made one mortgage payment in three years or longer.

The same thing is happening today here in 2023. Lenders aren’t starting the foreclosure process as often as they’re legally entitled to due to borrowers not making payments for months or years. It’s also been claimed by many people that the current number of millions of empty shadow inventory homes that are not currently listed for sale may exceed the total number of all homeless people nationwide. Whether this claim is accurate or not as it would be incredibly challenging to prove, our current listing home supply nationwide is still near historical lows.

For those people who claim that the housing market is busting, home prices nationwide increased by +10.1% year-over-year through October 2022 in spite of mortgage rates doubling or tripling in less than a year, according to CoreLogic. This home price “slowdown” is still almost two or three times higher than historical annual price gains.

Record High Consumer Debt & Rents

Total credit card debt reached a new record high of $930.6 billion in the fourth quarter of 2022, according to data released by TransUnion. At the same time, credit card rates and fees reached all-time record highs with average annual rates exceeded 20% for many consumers.

Consumer credit spending fell by a whopping 65% from November ($33.1 billion) to December 2022 ($11.56 billion) in spite of it being the traditionally peak holiday spending month. This is a potential major warning sign that a high percentage of consumers are tapped out and/or their credit card lenders are starting to drastically reduce the borrowers’ ceiling limit.

Several published economic surveys discovered that most of the polled consumers did not have $500 as cash available to cover any unexpected financial emergencies like with medical bills, rising utilities, or skyrocketing grocery costs. One of the most important pieces of information about the health of the economy is directly related to the typical consumers’ cash reserves. When access to cash is near historical lows and rents and mortgage payments are at historical highs, then something has to give at some point.

How can people qualify and afford these astronomical rents for just a 1-bedroom apartment that are listed below? Please keep in mind that many landlords want to see their tenant applicants have gross monthly income that is at least three times the proposed rent. For places like New York City, this would be equal to $11,370 in gross income to qualify for a typical one bedroom apartment that’s leasing for a median of $3,790 per month.

Top 5 Most Expensive Rent Cities (1-Bedroom Apartment)

1. New York, NY: $3,790
2. Boston, MA: $3,000
3. San Francisco, CA: $3,000
4. Miami, FL: $2,660
5. San Jose, CA: $2,540
Source: Boardroom

In many regions, the monthly rents are higher than the median mortgage payments. This trend is unlikely to continue onward as mortgage rates rise and rents start to flatten or fall.

Rising Rates and Distressed Properties

In some metropolitan regions like Los Angeles, they’ve had two and three year long moratoriums that protect tenants from paying their rents due to the Covid issue. Most landlords are small “Mom and Pop” type landlords who may be fortunate to own just one or two rentals. If their tenants haven’t paid rent in two or three years, then the property owner may default on their own mortgage and lose it to foreclosure, sadly.

Lenders and loan service companies will likely start to accelerate their foreclosure filings later this year. If so, this can be traumatizing for the distressed homeowners who may soon lose all of their equity and their roof over their head. At the same time, it can be an investment opportunity for others who keep their eyes open for bargain deals.

As of February 10, 2023, the Fed Funds Rate is at 4.58%. Some financial analysts think that the Fed may take their core rate up to 6% or higher later this year and keep it there for a relatively long period of time. If so, how will existing homeowners and buyer prospects be able to afford higher payments?

Many savvy real estate investors and licensees are now starting to describe early 2023 as a bit reminiscent of 2008. Yet, many others will say that the “the relatively low available supply home listing inventory” will protect us from any sort of a double-digit price collapse. While this may be very true and the Fed may be forced to suddenly start cutting rates in the near future if the economy really weakens, what happens if the shadow inventory is slowly released to the general public and the tenant and foreclosure moratoriums are lifted?

With any perceived positive, neutral, or negative situation, it’s usually very wise to focus on potential solutions for as many possible housing trends that may or may not happen in the near future. Few of us like to actually address possible negative situations as we remain stuck in the state of denial and cognitive dissonance where two contradictory situations must both be right at the exact same time even though they can’t both be true. What we avoid in life controls us, so we must face our fears head on and stay focused on the opportunities or solutions.


Rick Tobin

Rick Tobin has worked in the real estate, financial, investment, and writing fields for the past 30+ years. He’s held eight (8) different real estate, securities, and mortgage brokerage licenses to date and is a graduate of the University of Southern California. He provides creative residential and commercial mortgage solutions for clients across the nation. He’s also written college textbooks and real estate licensing courses in most states for the two largest real estate publishers in the nation; the oldest real estate school in California; and the first online real estate school in California. Please visit his website at Realloans.com for financing options and his new investment group at So-Cal Real Estate Investors for more details. 


Learn live and in real-time with Realty411. Be sure to register for our next virtual and in-person events. For all the details, please visit Realty411.com or our Eventbrite landing page, CLICK HERE.

Converting Home Equity to Cash

By Rick Tobin

The average American homeowner has the bulk of the household’s net worth tied up in the equity in their primary home where they reside. As noted in my past Equity Rich, Cash Poor article, the average US homeowner at retirement age has 83% of their overall net worth tied up in home equity (or the difference between current market value and any mortgage debt if not free and clear with no liens). As a result, the typical homeowner only has about 17% of their overall net worth available for monthly expenses.

Real estate isn’t as liquid, or the ability to quickly convert to cash, as a checking account. We can’t just go to our local grocery store and ask the cashier to deduct the full grocery cart from our debit account tied to our home’s promissory note or deed of trust. Yet, we all have to eat, so what are some ways to gain more access to cash that originate from the equity in our primary home or investment properties?


ADVERTISEMENT


Let’s take a closer look at ways to convert equity in real estate into spendable cash:

Sell your primary home or rental properties: If so, where will you live? Are rents nearby lower or higher than your current mortgage payments if you need to move? Are there any potential unforeseen tax consequences or benefits? Will you miss the monthly rental income from your investment properties?

Sale-and-leaseback: You find an investor willing to purchase your primary home while allowing you to stay there for months or years as a tenant.

Cash-out 1st mortgage: Pay off some or all forms of consumer debt (credit cards, auto loans, school loans, business loans, tax liens, etc.) with a larger mortgage while possibly lowering your overall monthly expenses significantly with or without any verified income.

Reverse mortgage: A combination of a mortgage and life insurance hybrid contract that gets you cash out as a lump sum and/or with monthly income payments to you while not requiring you to make any monthly mortgage payments. Lower FICO scores are usually allowed and minimal sourced monthly income like from Social Security may be sufficient to qualify.

Business-purpose loan as a 1st or 2nd: A type of loan that may be tied to an owner-occupied or non-owner-occupied property for so long as the funds are used for business or investment purposes such as assisting your self-employed business or buying more rental properties. These types of loans have much less paperwork and disclosure requirements and can be funded within a few weeks with or without income or asset verification.

Declining Dollars and Rising Expenses

Although U.S. wage earnings rose 5.1% nationwide between the 2nd quarter of 2021 and 2022, the published Consumer Price Index (CPI) inflation rate reached 9.1% in June 2022 which was the highest inflation rate pace in over 40 years. As a result, the purchasing power of our dollars continues to decline while consumer goods and service prices rise too quickly.

In July 2022, credit card rates and overall consumer debt balances across the nation reached all-time record highs. This was partly due to more Americans relying upon their credit cards to cover basic living expenses to offset inflated prices.

Simultaneously, the Federal Reserve increased short-term rates a few times so far this year while making consumer debt balances more expensive. At the June and July meetings for the Federal Reserve, they increased short-term rates 0.75% at each meeting. This was the largest back-to-back or consecutive rate hike for the Federal Reserve in their entire history.

To bridge the gap between expenses and income, total credit card debt balances surpassed $890 billion in the second quarter of 2022. The increase in overall credit card debt rose 13% in the second quarter of 2022, which was the largest year-over-year increase in more than 20 years. Near the start of 2022, the average American had close to $6,200 in unpaid credit card balances as per the Federal Reserve and Bankrate.

An additional 233 million new credit cards were opened in the second quarter. This was the largest new credit card account increase in one quarter since 2008 (or near the start of the Credit Crisis). A consumer who pays just the minimum balance for a credit card with a few thousand dollar balance may need more than 30 years to pay off the entire debt partly due to the horrific annual rates and fees that are generally much higher than 30-year mortgage rates.


ADVERTISEMENT


Short-Term Cash Supplies

It would take 64.4 days for a Californian to run out of cash if they had average American savings amounts of $9,647 based upon a recent study from ConsumerAffairs.

Here’s the top 10 most expensive regions in the nation and the estimated time that it would take to run out of cash:
Hawaii (62.5)
California (64.4)
Washington, D.C. (72.1 days)
Massachusetts (73.6 days)
New Jersey (74.8 days)
Connecticut (76.3 days)
Maryland (77.9 days)
Washington (79 days)
New York (79.9 days)
Colorado (80.8 days)

Living Wages, Debt, and Wealth Creation

Another survey conducted by GOBankingRates that was published in July 2022 found that the median annual living wage, which is defined as the minimum income amount needed to cover expenses while saving for retirement, is $61,617 per U.S. household. However, the Top 14 most expensive states required much higher annual household income or living wages as listed below:

1. Hawaii: $132,912
2. New York: $101,995
3. California: $94,778
4. Massachusetts: $86,480
5. Alaska: $85,083
6. Oregon: $82,926
7. Maryland: $82,475
8. Vermont: $78,561
9. Connecticut: $76,014
10. Washington: $73,465
11. Maine: $73,200
12. New Jersey: $72,773
13. New Hampshire: $72,235
14. Rhode Island: $71,334

Nationally, the lowest required living wage income for households was $51,754 in Mississippi.

These Top 14 expensive living wage regions also share something in common in that they have some of the highest median-price home values in the nation, especially Hawaii, New York, and California. While the monthly living wages may be highest in these regions, the net worths for homeowners is probably much higher due to so many properties valued well over $1 million dollars.

Ideally, we should all focus on keeping our monthly expenses as low as possible while investing in prime real estate to boost our overall net worth. If so, you’re more likely to retire sooner rather than later while your money works hard for you (or rapidly increasing annual home value equity gains) instead of you working too hard for your money.


Rick Tobin

Rick Tobin has a diversified background in both the real estate and securities fields for the past 30+ years. He has held seven (7) different real estate and securities brokerage licenses to date, and is a graduate of the University of Southern California. Rick has an extensive background in the financing of residential and commercial properties around the U.S with debt, equity, and mezzanine money. His funding sources have included banks, life insurance companies, REITs (Real Estate Investment Trusts), equity funds, and foreign money sources. You can visit Rick Tobin at RealLoans.com for more details.


Learn live and in real-time with Realty411. Be sure to register for our next virtual and in-person events. For all the details, please visit Realty411.com or our Eventbrite landing page, CLICK HERE.

Inflation, Tappable Equity, and Home Value Trends

Image from Pixabay

By Rick Tobin

Historically, rising inflation trends have benefited real estate better than almost any other asset class because property values are usually an exceptional hedge against inflation. This is partly due to the fact that annual home prices tend to rise in value at least as high as the annual published Consumer Price Index (CPI) numbers.

However, inflation rates that are much higher than more typical annual inflation rates near 2% to 3% can cause concern for the financial markets and Federal Reserve. As we’re seeing now, the Fed plans to keep raising interest rates to combat or neutralize inflation rates that are well above historical norms.


ADVERTISEMENT


The true inflation rates in 2022 are at or above the published inflation rates back in 1981 when the Fed pushed the US Prime Rate up to 21.5% for the most creditworthy borrowers and the average 30-year fixed mortgage rate was in the 16% and 17% rate range. Back in the late 1970s and early 1980s, rising energy costs were the root cause of inflation just like $5 to $7+ gasoline prices per gallon in 2022.

All-Time Record High Tappable Equity

Image from Pixabay

In the first quarter of 2022, the collective amount of equity money that homeowners with mortgages on their properties could pull out of their homes while still retaining at least 20% equity rose by a staggering $1.2 trillion, according to Black Knight, a mortgage software and analytics company.

Mortgage holders’ tappable equity was up 34% in just one year between April 2021 and April 2022, which was a whopping $2.8 trillion in new equity gains.

Nationally, the tappable equity that homeowners could access for cash reached a record high amount of $11 trillion. By comparison, this $11 trillion dollar amount was two times as large as the previous peak high back in 2006 shortly before the last major housing market bubble burst that became more readily apparent in late 2007 and 2008.

This amount of tappable equity for property owners reached an average amount of $207,000 in tappable equity per homeowner. If and when mortgage rates increase to an average closer to 7% or 8% plus in the near future, then home values may start declining and the tappable equity amounts available to homeowners for cash-out mortgages or reverse mortgages will decline as well.

All-Time Record High Consumer Debts

The March 2022 consumer credit report issued by the Federal Reserve reached a record high $52.435 billion dollars for monthly consumer debt spending. This $52 billion plus number was more than double the expected $25 billion dollar spending amount expectation and the biggest surge in revolving credit on record. In April 2022, the consumer spending numbers surpassed $38 billion, which was the #2 all-time monthly high.

Image from Pixabay

For just credit card spending alone, March 2022 were the highest credit card spending numbers ever at $25.6 billion. The following month in April, credit card debt figures exceeded $17.8 billion, which was the 2nd highest credit card charge month in US history.

While many people are complaining about mortgage rates reaching 5% and 6% in the first half of 2022, these rates are still relatively cheap when compared with 25% to 35% credit card rates and mortgage rates from past decades that had 30-year fixed rate averages as follows:

● 1980s: 12.7% average 30-year fixed mortgage rates
● 1990s: 8.12%
● 2000s: 6.29%

In the 2nd half of 2022, it’s more likely that many borrowers will fondly look back at 5% and 6% fixed rates as “relatively cheap” if the Federal Reserve does follow through with their threats to increase rates upwards of 10 times over the next year in order to “contain inflation” while punishing consumers at the same time who struggle with record consumer debt (mortgages, student loans, credit cards, automobile loans, etc.).

Financially Insolvent Government Entitlement Programs

There are published reports by the Trustees of both Social Security and Medicare about how the two programs are potentially on pace towards financial insolvency in the not-too-distant future. The Social Security Trustees claim that their retirement program may not be able to fully guarantee all benefits as soon as 13 years from now in 2035. Over the next decade, Social Security is calculated based upon current income and expense numbers to run budget deficits of almost $2.5 trillion dollars.


ADVERTISEMENT


As per the Trustee’s published report linked below, it’s claimed that the Social Security Disability Insurance (SSDI) trust fund may deplete its reserves as early as 2034.
Social Security report link: https://www.ssa.gov/OACT/TR/2022/tr2022.pdf

If and when the Social Security trust fund starts operating with cash-flow deficits, all beneficiaries, or Americans who receive the Social Security benefits, may be faced with an across-the-board benefits cut of 20% as suggested by the Trustees. For many Americans who struggle to get by on 100% of their Social Security benefits, the threat of a possible future reduction in amounts of 20% or more can be quite scary to think about.

The average Social Security benefit paid out nationwide in 2022 is estimated to be $1,657 per month or $19,884 per year. A 20% reduction in monthly benefits without using future inflation adjustments would be equivalent to a reduction of $331.40 per month in benefits and a new lower monthly payment amount of $1,325.60.

The Medicare Hospital Insurance (HI) trust fund is also on track to exhaust its cash reserves over the next six years by 2028, as predicted by the Medicare Trustees in their own gloomy report that’s linked here: https://www.cms.gov/files/document/2022-medicare-trustees-report.pdf

Let Your Money Work For You

Image from Pixabay

As noted in my past published articles, the bulk of a homeowner family’s overall net worth comes from the equity in their primary residence. The average US homeowner at retirement age has approximately 83% of their overall net worth tied up in the equity in their home and pays monthly expenses from just the remaining 17% of overall net worth that is held in checking, savings, or pension accounts.

While inflation usually is beneficial to pushing up real estate values at a rapid annual pace, inflation is also devastating to the value of the dollar in your pocket as purchasing powers decline. Inflation for real estate does have a ceiling level at which it becomes detrimental to housing values if the Fed starts doubling or tripling mortgage rates to slow down the inflation rates.

Equity in properties isn’t so easy to access to buy food, gas, clothing, or to pay your utilities as having cash on hand. If and when future government entitlement benefits decrease and inheritance and property taxes may increase, then being self-sufficient while earning monthly income from tenants in your rental properties or by pulling cash out of your properties near peak highs may go a long way towards allowing you to maintain the same standard of living that you’ve been accustomed to over the years.


Rick Tobin

Rick Tobin has a diversified background in both the real estate and securities fields for the past 30+ years. He has held seven (7) different real estate and securities brokerage licenses to date, and is a graduate of the University of Southern California. Rick has an extensive background in the financing of residential and commercial properties around the U.S with debt, equity, and mezzanine money. His funding sources have included banks, life insurance companies, REITs (Real Estate Investment Trusts), equity funds, and foreign money sources. You can visit Rick Tobin at RealLoans.com for more details.


Learn live and in real-time with Realty411. Be sure to register for our next virtual and in-person events. For all the details, please visit Realty411.com or our Eventbrite landing page, CLICK HERE.

The Non-Owner, No Income (NONI) Loan Solution

Image from Pexels

By Rick Tobin

Are all loans second to NONI (Non-Owner, No Income) for cash flow purposes? Does your investment property give you a positive annual cash flow with or without significant vacancy rates, repairs, nonpayment of rents due to tenant moratoriums or other reasons, and costly management expenses? How many investment property owners are stuck with high 7% to 10%+ private money or an expensive 30-year fixed mortgage that creates negative monthly cash flow? The NONI interest-only loan or fully amortizing loan with 7, 10, 30, and 40-year fixed terms is an exceptional financial choice.

NONI Interest-Only Loans

First off, can you afford your monthly mortgage payment? Without positive cash flow and the ability to pay your mortgage payments on time, your investment properties may be at risk for future forbearance, loan modification, or distressed sale situations where you could later lose your positive equity in a future foreclosure. The combination of positive cash flow and compounding equity gains should be the primary goal for investors instead of having unaffordable mortgage payments.

Here’s some eye-opening NONI loan products highlights that keep customers coming back for more NONI products, especially if the investor owns 2, 5, 10, or 20+ rental properties:

  • Starting interest-only rates as low as 3.875%*
  • Designed for business purpose 1-4 unit residential loans in most states
  • No income or employment collected on the loan application
  • Loan amounts to $3.5 million for non-owner properties
  • No 4506-T, tax returns, W-2s or pay stubs
  • Qualification is based on property cash-flow, NOT borrower income
  • First time investors allowed
  • Multipurpose LLC allowed
  • Unlimited cash-out up to 75% LTV
  • As little as 0 months reserves (use cash out for reserve qualifications)
  • NONI doesn’t care how many properties a borrower owns
  • The lower I/O payment (when I/O option is chosen) is used when calculating DSCR and cash reserves
  • 85% LTV available for purchase and rate/term transactions (680+ FICO)
  • Rental income is taken from an existing lease or the rent survey from the appraisal and compared to the mortgage payment to determine debt coverage ratio. (all program guidelines and rates subject to change and qualification)

For traditional loan programs, many lenders will take 75% of your gross rents to qualify for a new mortgage loan because the lender assumes that you have vacancies, repairs, and property management fees. For easy math, a rental property with $1,000 per month in gross income is underwritten as if it were $750 per month and another pricier property with $10,000 per month in rental income is analyzed as if it were $7,500 per month.

Image from Pixabay

For NONI, on the other hand, you can qualify at 1.0 DSCR (Debt Service Coverage Ratio) or break-even levels. For example, your rental home averages $2,000 per month, so your newly proposed mortgage payment (including property taxes, insurance, and homeowners association fees, if applicable) must be equal or lower to that same gross rental income. As a result, it’s much easier to qualify for a NONI loan product than any other residential mortgage loan that I know of today.

30-Year Fixed vs. 10-Year Interest-Only

A 30-year mortgage payment doesn’t usually begin to pay down any significant amount of loan principal until after the 7th year. The average mortgage borrower keeps their loan for nearly 7 years, so an interest-only loan product can be a much more solid choice today for many borrowers.

Let’s compare the fully amortizing 30-year fixed payment with a 10-year interest-only payment with cash-out options to see the difference for the same 3.875%* rate:

Loan amount: $250,000
30-year fixed rate payment: $1,175.59/mo. (principal and interest)
10-year fixed interest-only: $807.29/mo.

Loan amount: $500,000
30-year fixed rate payment: $2,351.19/mo. (principal and interest)
10-year fixed interest-only: $1,614.58/mo.

Loan amount: $750,000
30-year fixed rate payment: $3,526.78/mo. (principal and interest)
10-year fixed interest-only: $2,421.88/mo.

Loan amount: $1,000,000
30-year fixed rate payment: $4,702.37/mo. (principal and interest)
10-year fixed interest-only: $3,229.17/mo.

Loan amount: $2,000,000
30-year fixed rate payment: $9,404.74/mo. (principal and interest)
10-year fixed interest-only: $6,458.33/mo.

Loan amount: $3,000,000
30-year fixed rate payment: $14,107.11/mo. (principal and interest)
10-year fixed interest-only: $9,687.50/mo.

*APRs from 4.79%: The 10-year fixed loan converts to an adjustable for the remaining 20 or 30 years with 30-year and possible 40-year loan term options. There are also 30-year and 40-year fixed interest-only loan programs at higher rates (all rates and programs subject to change)

Increasing Inflation and Rates, Decreasing Dollar Value

The more money that is created together between the US Treasury and Federal Reserve, the lower the purchasing power. Inflation can severely damage the purchasing power of the dollar while generally benefiting real estate assets.

US M1 Money Supply (February 2020): $4 trillion
US M1 Money Supply (March 2020 – October 2021): From $4 to $20 trillion

Image from Pixabay

Or, 80% of today’s M1 Money Supply, or an additional $16 trillion dollars in circulation, was created within just 22 months (March 2020 to October 2021).

Most Americans create the bulk of their family’s net worth from the ownership of real estate, not hiding cash under their mattress or holding stocks or bonds. Inflation is also a hidden form of taxation. One of the best ways to offset weaker dollars is to buy and hold real estate as a hedge against rising inflation while also generating monthly cash flow.

Today’s younger investors may not remember 10% to 20% fixed mortgage rates from years past. If your rental properties are losing money at a 3% or 4% fixed rate today, then any future properties purchased with higher rates will lose even more money unless you select a much more affordable interest-only loan product.

Let’s take a look next the average published 30-year fixed rate for owner-occupants who qualify with full income and asset documentation by decade:

● 12.7% in the 1980s
● 8.12% in the 1990s
● 6.29% in the 2000s
● 4.09% in the 2010s

The common link between each of these decades was that perceived inflation risks were usually a core reason why the Federal Reserve increased interest rates in order to quash inflation. Today’s published inflation rates are at 40-year highs. Yet, they are still underreported and are actually much higher as partly noted by annual used car prices rising almost 48% in just 12 months near the end of 2021.

Doubling Asset Values

If you keep the old Rule of 72 (how long it takes to double an asset value by the annual gain or interest return projections) in mind with rising inflation trends continuing to boost housing prices, you will clearly see the potential to boost your net worth. For example, a home doubles in value based upon the gains such as a 7.2% annual increase that will take 10 years for the home to double in value (72 / 7.2% = 10 years).

Image from Pixabay

Between November 2020 and November 2021, it was reported that the average home price, including distressed properties, increased more than 18%. If that home price gain trend continued at the same annual pace, the average home price could double in value every 4 years (72 / 18 = 4 years). In many pricey coastal regions, homes have appreciated 30% to 35%+ per year over the past few years. As a result, many investors have seen their home values double in just two or three years.

As rates are more likely to increase than decrease in the future, the interest-only loan products that can be fixed for 7, 10, 30, or 40 years make more sense from a cash flow and peace of mind standpoint.

While NONI keeps your payments low, your net worth may be boosted sky high as the soaring inflation trends continue and properties may double or triple in value!

Rick Tobin

Rick Tobin has a diversified background in both the real estate and securities fields for the past 30+ years. He has held seven (7) different real estate and securities brokerage licenses to date, and is a graduate of the University of Southern California. Rick has an extensive background in the financing of residential and commercial properties around the U.S with debt, equity, and mezzanine money. His funding sources have included banks, life insurance companies, REITs (Real Estate Investment Trusts), equity funds, and foreign money sources. You can visit Rick Tobin at RealLoans.com for more details.


Learn live and in real-time with Realty411. Be sure to register for our next virtual and in-person events. For all the details, please visit Realty411.com or our Eventbrite landing page, CLICK HERE.

This Is What Will Really Cause The Next Housing Crash…

By Fuquan Bilal

Whether you believe we are already in a correction or not, here’s the one thing that may really be responsible for tipping the housing market over the edge.

It’s sellers asking too much.

Who’s to Blame for the Housing Crash?

There were lots of people, groups and organizations blamed for the housing bubble and crash in 2006-2008.

crisis-2061342_1280At first they tried to blame investors and house flippers. At least until the government needed them to take on all the distressed properties, and actually loosened lending regulations to sell and finance more houses to investors.

Appraisers, too, were blamed for overinflating values, often in collusion with banks. Banks were committing all types of fraud. And then forced insurance and foreclosure fraud really put the icing on the cake.

To top it off, interest rates through 2006 were on the rise, which really stalled the market. Especially in tandem with cutting back on lending and ending easy to get loans. Something which the government has just done again with the FHA, after years of subprime type lending.

All of the things are happening again now. However, probably most significantly of all, is that property owners ran into problems when they owed too much, cash flow started slowing, and people stopped buying because prices just didn’t make sense anymore. The only people they made sense for were speculative flippers, and eventually they hit a ceiling too.

Uninformed & Unrealistic Sellers

All you have to do is hop on to Zillow or Realtor.com for a few minutes, and you’ll see plenty of examples of owners and agents listing for as much as double as the value estimates right alongside their asking prices. Often this is right next to a graph clearly showing a recent steep dive in that property’s value. One property in Florida shows it was recently bought for $21,000, is valued around $70,000, but the seller is asking $124,000 for it. There are plenty of other public listings out there that you can see have been vacant and listed for a year. The sellers have barely budged in lowering their asking prices.

chart-1585601_1280For easy math, take a house that may be worth $100,000, but the seller and realtor have been demanding $120,000. After a year, they finally fold and reduce the price to $100,000. Only now it may only be worth $70,000. So it sits on the market for another year. Finally, out of desperation they lower the price to $70,000, but now no one wants to pay more than $35,000 for it, because of the market and economy. They are completely stuck. They may have put in more than the property is now worth just to hold it all that time. They may owe more than anyone is willing to pay right now. They are financially tapped out and frustrated. It gets foreclosed on, and they lose everything.

There are probably several hundred thousand sellers in this situation right now, at least. Millions if you count all phases of the journey we just outlined.

shopping-1724299_1280It could easily be avoided by pricing right. Of course, in a few years this same property will probably be worth $150,000 or more, and could be generating $1,000 a month in rents in the meantime. Most just won’t be able to manage through it though.

So, we’re ending up with a lot of new deal flow coming through. Again, we’ll see local governments and banks flush with distressed mortgage notes and REOs for qualified funds to acquire at discounts. We’re also seeing investors selling off portfolios of hundreds of units to cash out.

It’s a shame that some sellers will have to go through this journey. Yet, there is great opportunity for investors who have the connections to acquire right priced assets and know how to manage them.

Investment Opportunities

Find out more about investing in secured debt and real estate, go to NNG Capital Fund


Fuquan

Fuquan Bilal

Fuquan Bilal founded NNG in 2012 with the principal mission of capitalizing on the growing supply of mortgage notes in the interbank marketplace. Mr .Bilal utilizes his 17 years of residential and commercial real estate success to identify real estate opportunities and capitalize on them. To date, he has successfully managed three private mortgage note funds that primarily invest in singlefamily performing and non­performing mortgage notes. His financial acumen and proprietary set of investment criteria enable him to purchase underperforming real estate assets at a deep discount of face and market values, thereby increasing the value of the assets. This, coupled with his ability to maximize the use of leverage, enables him to build strong, secured portfolios with solid passive income flows.

Is Credit Card Stacking Really Going to Help You Fund Your Real Estate Deals?

By Jessica Guisinger and Merrill Chandler

If you are a new or seasoned real estate investor and you have been looking for capital to fund your real estate deals, there is a good chance you have heard of credit card stacking.

Credit card stacking is the practice that credit brokers use to help individuals acquire credit by applying for multiple personal credit cards at the same time. The idea is that once you are approved for multiple credit cards, you can use the newly extended credit to fund your real estate deals. While getting multiple credit cards at the same time may initially sound like a great idea, doing so can create serious problems—especially if you attempt this strategy without fully understanding the consequences.

“I think just about the worst mistake I’ve ever seen an investor make is funding a deal by employing a credit card stacking strategy,” said Jessica Guisinger, the referral partner liaison with CreditSense, a firm that specializes in improving both personal and business fundability for real estate investors and small businesses. A cursory review of their website reveals they are nothing like a credit repair agency, but rather a Fundability Optimization firm, that gives its real estate investor students and clients a great deal of specialized insight into the inner workings of credit underwriting in general, and credit approvals in particular.

“We see a lot of offer there that offer investors “funding” to do deals, but in reality they are just managing credit card stacking [for the investor],” Jessica explained. “These companies do not disclose—and investors rarely know until it’s too late— that getting the funding they need by maxing out these new credit cards will absolutely ruin the investor’s chance of obtaining future funding, and it inevitably tanks that person’s personal credit profile and score as well. And to add insult to injury, the 0% offer that was so attractive almost always disappears when they try to liquidate their credit card limit for cash.”

What credit card stacking participants don’t know is that even if they pay on-time for the next 24 months, they will be flagged as high risk borrowers because lenders view this practice as an extremely high risk behavior. The investor will also be flagged as high risk because of the sudden spike in utilization (balance to limit ratio), and a demonstration of poor credit management.

“A far better solution is to use true business lines of credit as your funding source. When you have the right credit profile these lines of credit offer the lowest rates available and you can get these business lines of credit with full check-writing capability at 3% to 6% to fund your deals,” recommended Jessica. “This type of funding is not only check-accessible, but it is unsecured as well. This feature offers a huge advantage for real estate investors because it helps make them MORE fundable while improving their personal credit rather than destroying it.”

Many real estate investors assume they cannot qualify for unsecured business lines of credit, or that they will need to pay high interest rates in order to obtain them without ever discovering the truth. Jessica noted that with the right borrowing strategies, this is patently untrue. “A lot of real estate investors need help becoming fundable because they have been playing the funding game without knowing the rules. And, not knowing the rules is made even worse because real estate investing is considered a high risk business by lenders—they don’t want to even talk to you much less give you money,” she said.

Jessica continued, “Thankfully there is hope. There’s a way for real estate investors to get inexpensive money from top tier lenders. They simply need to learn the rules of the funding game and then play that game at a professional level. In fact, if you know what you are doing, you can obtain these unsecured business lines of credit and then strategically grow them to $1 million or more in real estate funding,” she said.

“Experts who help others acquire this type of funding do not just jump in without exploring the current fundability of an interested investor,” Jessica concluded. “If someone does not do a little bit of fact-finding and a comprehensive fundability analysis before they lay out a plan for you, be on alert,” she said.


Here’s The Capital You Need

By Dana Bersch

There’s a whole buffet of real estate deals out there, but with powerful unsecured credit lines from Stonebridge Capital Group, you can cherry pick the deals you want on-demand.

At Stonebridge Capital , we don’t believe you need a winning lottery ticket to realize your financial dreams. There is a constantly moving “good luck conveyor belt” in front of today’s business owners, entrepreneurs, and real estate investors. The catch is that “you need the money to take advantage of those opportunities, and good deals simply won’t wait for you to find the money.”

The Biggest Problem You Face Today

The most pressing issue on the current landscape isn’t a lack of deals, buyers, or rentersDana “the biggest problem facing business owners today is a lack of access to capital.”

The data shows that most businesses fail because they just run short of cash flow. They can no longer pay the bills, push out great marketing, or seize on the best opportunities. Some fail because they don’t appreciate their need for funding, or how much they need. Others are stuck with rigid funding sources and arrangements that don’t serve them well, or simply haven’t found an attractive source of financing. Ultimately the main source of failure is all about the money.

We are constantly reminding all real estate investors and entrepreneurs that they are in business. “Flipping houses is a business.”  As is acquiring and operating rentals, wholesaling, and note investing, and so on.

I know the challenges these entreprenuers face well. As a business owner for more than 30 years,  I understand the pitfalls small businesses have in having access to capital, which is critical for their success.  Before I started  Stonebridge Capital  in 2006 I was involved in several industries, including manufacturing, healthcare,  restaurants, real estate, oil and gas investments, and entertainment.

Over the last decade the Stonebridge team  has been working with hundreds of entrepreneurs, investors, and business owners to help them recognize their need for additional capital, position themselves to obtain the best funding, and  obtain generous lines of credit.

The Unsecured Credit Line Advantage

Stonebridge Capital specializes in providing business and personal lines of credit from $25k to $250k.  We also have access to bank term loans, which can add to the amount of funding.

This credit is working capital that real estate investors, entrepreneurs, and business owners can use for just about anything they need. That means acquiring new properties, down payments, paying down high-interest debt, rehab work, marketing, filling the gaps when tenants are late on rent, etc.

Credit lines offer a huge advantage to real estate professionals. You only pay on the money you are actively using, it helps you qualify for the mortgage or hard money loan, covers expenses while you are involved in your rehab, and once you cash out on deals and pay it down, the money is right there to use again without  the application and appraisal hassles and expenses. We receive a sizable portion of our business from referrals from mortgage brokers and hard money lenders for clients who need to increase their down payment to qualify for their loan and to bridge the funding gap from what they provide too. Additionally, using an unsecured line of credit means no liens on your properties, and never diluting your business ownership or giving up control as with equity fundraising.

Features to Love:

  • Funding in just 10 to 21 days
  • 24 hour preapproval
  • No application fee
  • 0% interest for up to 24 months
  • Stated income
  • New startups OK
  • 680+ FICO score
  • Free guidance on maintaining, optimizing, and growing your credit

Don’t Prejudge Your Credit

If an extra $250,000 could help your business (and you can bet it can), “don’t prejudge your credit.” There are no application fees, and you can find out how much of a line you can get within 24 hours..

Check it out and get pre-approved online at www.sbcapgroup.com/sb or call 480.626.1772.