Are You Focused on Commercial Real Estate?

By Rick Tobin

Earlier this year in January, economists from the International Monetary Fund claimed that commercial real estate prices had fallen at the steepest pace in more than 50 years. As we now approach the fourth quarter here in 2024, the price drops have escalated and only worsened for property owners. Now, we might be seeing the worst commercial property price declines in U.S. history.


article continues after advertisement


Approximately 20%, or $929 billion, of the $4.7 trillion dollars’ worth of outstanding commercial mortgages owed to lenders and investors may balloon or become all due and payable by the end of 2024, as per the Mortgage Bankers Association’s 2023 Commercial Real Estate (CRE) Survey of Loan Maturity Volumes.

Between 2024 and 2028, upwards of $2.81 trillion in commercial loans are scheduled to come due and need to be paid off or refinanced, according to Trepp. Within this same analysis provided by Trepp, they project that more than $533 billion will balloon or come due in 2025. The largest commercial mortgage holders for these commercial mortgages coming due are regional banks and thrifts that hold over half of these maturing loans through 2028.

Commercial Real Estate Trends

Let’s take a look at both positive and negative commercial property trends across the nation in recent years:

  • The estimated total dollar value of commercial real estate was $22.5 trillion as of Q4 2023, which makes it the fourth-largest asset market in the nation following stocks or equities, residential real estate, and Treasury securities. (Federal Reserve’s April 2024 Financial Stability Report),
  • By 2050, commercial building floor space is expected to reach 124.3 billion square feet, a 33% increase from 2020. (Center for Sustainable Systems, University of Michigan)
  • 72% of commercial buildings in the US are 10,000 square feet or smaller. (National Association of Realtors)
    The typical length of a building lease in the US is three to 10 years. (DLA Piper)
  • Approximately 69% of all commercial buyers in the US need financing to purchase properties. (National Association of Realtors)
  • As of July 2024, the national office vacancy rate reached a whopping 20.1%. This was the very first time ever that the U.S. vacancy rate surpassed 20%. (CommercialEdge)
  • In 2024, the U.S. apartment construction industry is expected to break a new all-time record for apartment units delivered with well over 500,000 units completed, which is 30% higher than back in 2022. (Fannie Mae)
  • An estimated one-third of industrial space in the US is more than 50 years old. (NMRK)
  • The Inland Empire (Riverside and San Bernardino counties) in California had averaged an incredibly low 1.2% vacancy rate for industrial space in 2021 and/or 2022. (Commercial Edge)
  • However, vacancy rates for industrial properties in the Inland Empire skyrocketed to 6.8% by Q1 of 2024, a 400-basis point vacancy rate increase compared to 2023. The Inland Empire now has the second highest vacancy rate for industrial properties on the West Coast, behind only Phoenix. (Kidder Matthews)
  • Nationally, the industrial real estate vacancy rate reached 6.1% in the first half of 2024. (CommercialEdge)
  • For every $1 billion of growth in the e-commerce sector, it requires an extra 1.2 million square feet of new warehouse space. (Prologis)

Is Multifamily Strong or Not?

In many U.S. regions, the multifamily sector is very strong partly since so many tenants can’t afford to buy homes nearby that are currently priced at all-time record highs. In other regions, multifamily apartment landlords may be struggling with significant financial losses.

The multifamily apartment mortgage default rate has quadrupled over the past year, according to Freddie Mac. Last year in 2023, this year in 2024, and through at least 2025, more brand new apartment units will be completed and available for lease than at any other time since as far back as 50+ years ago in 1973.

Multifamily apartment landlords across the nation are defaulting on their mortgages with decade-high rates in states like California, Texas, Florida, and elsewhere.

Some of the main factors why multifamily apartment mortgage default rates are rising are as follows:

1. The owner’s existing mortgage rate may have increased by 100% or more after their previously 3-year, 5-year, 7-year, or 10-year fixed rate converted to a new adjustable rate at today’s much higher mortgage index. As a result, the once positive monthly cash flow turned negative due to the higher mortgage rates and payments.

2. Rising vacancy rates as fewer tenants could afford rapidly increasing rents in many of these apartment building locations found in various metropolitan regions.

3. In other regions, the vacancy rates had increased so much that landlords had to drop their rent prices which, in turn, turned monthly profits into losses.

4. Skyrocketing costs for various types of landlord insurance or umbrella insurance policies as well as increased litigation costs from unhappy or injured tenants.

The multifamily market is projected to add or deliver another 574,000 new apartment units in 2024 alone, according to an analysis shared by the CoStar Group. As a result, future rent prices may start falling as the available supply exceeds the demand.

Upside-Down Office Buildings

Almost 45% of all office buildings nationwide that are leveraged with debt are upside-down or underwater where the existing mortgage debt exceeds the current market value, according to sources like ZeroHedge, Bloomberg, and Morgan Stanley. Some office buildings are now selling for as low as $9 per square foot, not $900/sq. ft.

An eye-opening example of how massive some of these commercial property prices have plunged was the recent April 2024 sale of the 44-story AT&T Center office building in St. Louis, Missouri. Back in 2006 near the previous real estate bubble peak, the same building sold for $205 million dollars. In April, this property sold for just $3.6 million, which was a staggering 98% value drop.

Some savvy investors who purchase these discounted office buildings may choose to convert them into multifamily apartment buildings if the remodel and rezoning costs aren’t too high. Are you seeing heavily discounted office building deals in the areas where you live or invest as well?

Two of the main causes for falling residential and commercial real estate values are related to rising unemployment and upside-down properties as more people may soon clearly see, sadly.

All-Time Record Consumer Debt and Defaults

The ability to pay rent or a mortgage payment is directly related to access to cash and credit for most people. When times are more challenging and the employment or investment income is either lower or nonexistent, many people choose to access their credit cards to make their monthly payments. Once the credit card limits are reached, some tenants may not be able to pay their rents.

There is not a single state in the U.S. today with less than a 10% credit card delinquency rate for their residents as credit card APRs are near 28% to 40% in 2024, depending upon the credit card issuer and the borrowers’ creditworthiness .

Back near the depths of the Great Recession in April 2009 when credit card rates were closer to 12%, the national credit card delinquency rate was only 6.77%.

Highest Credit Card Defaults

By state, here is the percentage of consumers who are delinquent on one or more accounts:

* Mississippi – 39%
* Louisiana – 32%
* Alabama – 31%
* Arkansas – 30%
* Oklahoma – 28%
* Kentucky – 28%
* South Carolina – 27%
* Tennessee – 26%
* Texas – 25%
* West Virginia – 25%
* North Carolina – 24%
* Indiana – 24%
* Georgia – 23%
* New Mexico – 23%
* Missouri – 22%
* Arizona – 20%
* Nevada – 19%
* Wyoming – 18%
* Oregon – 17%
* California – 15%
* Florida – 15%
Sources: Trading Economics and John Williams


article continues after advertisement


Top 10 Credit Default Cities

Here are the U.S. cities where the largest share of people are behind on their credit cards by at least one payment.
1. McAllen, Texas — 51.7 percent
2. El Paso, Texas — 46.3 percent
3. Baton Rouge, La. — 45 percent
4. Greensboro, N.C. — 44.8 percent
5. Columbia, S.C. — 44.6 percent
6. Jackson, Miss. — 44 percent
7. San Antonio, Texas — 43.8 percent
8. Augusta, Ga. — 43.3 percent
9. Greenville, S.C. — 42.6 percent
10. Memphis, Tenn. — 42.5 percent

Source: LendingTree

Discounted Real Estate Buying Opportunities

Just like following the Great Depression, the Savings & Loan Crisis, and the Great Recession, there were incredible discounting buying opportunities for homeowners and investors who were searching for both residential and commercial real estate deals.

You must continue to stay focused on the opportunities rather than on the obstacles to get ahead in this world. “Out of chaos comes opportunity” as I like to say repeatedly to friends, family, and clients.

If 99 people are running towards the hills and doing nothing, you can be the sole brave and wise person who buys the property for almost cents on the dollar like some of the office building deals. If so, you might create generational wealth for you and your family.


Rick Tobin

Rick Tobin has worked in the real estate, financial, investment, and writing fields for the past 30+ years. He’s held eight (8) different real estate, securities, and mortgage brokerage licenses to date and is a graduate of the University of Southern California. He provides creative residential and commercial mortgage solutions for clients across the nation. He’s also written college textbooks and real estate licensing courses in most states for the two largest real estate publishers in the nation; the oldest real estate school in California; and the first online real estate school in California. Please visit his website at Realloans.com for financing options and his new investment group at So-Cal Real Estate Investors for more details. 


Learn live and in real-time with Realty411. Be sure to register for our next virtual and in-person events. For all the details, please visit Realty411.com or our Eventbrite landing page, CLICK HERE.

The California Gold Rush Boom

By Rick Tobin

The California statewide median home price reached an all-time record high of $908,040 in May, which was more than $500,000 higher than the national average price of $407,600. Through June 2024, the median home price average remained above $900,000 for three consecutive months in California.

By the end of the 1st quarter of 2024, California homeowners saw the largest year-over-year equity gain in the nation at $64,000. Los Angeles metropolitan region homeowners had even larger gains while netting closer to $72,000, according to the CoreLogic Homeowner Equity Insights report.


article continues after advertisement


The CoreLogic analysis showed that homeowners across the nation with mortgages (approximately 62% of all properties) had total equity gains of roughly $1.5 trillion dollars between the first quarter of 2023 and 2024, an annualized percentage gain of +9.6%. Massachusetts had the #2 overall state equity gain at $61,000 and New Jersey was ranked #3 at $59,000.

By comparison, the median national home price hovered between about $430,000 and $445,000 through May and June 2024, according to multiple sources such as Realtor.com. The typical home listing nationwide took 45 days on average to sell, which is still well below the historical average time to sell listed properties.

These massive equity gains each year for most states have dropped the average loan-to-value (LTV) for mortgaged homes nationwide to a record low 48.3% LTV. While other types of consumer debt are currently near all-time record highs for credit cards, student loans, and automobile loans, many American homeowners have never been wealthier.

No matter how fast national home prices are increasing each year, California home prices continue to remain at least twice as high as the national average.

Two Top California Home Regions

There are several booming housing regions across California. Yet, two of the best overall housing markets remain here in Southern California – Orange County and San Diego County.

1. Orange County, California: Through June 2024, Orange County topped a ranking of home-price gains for 30 U.S. cities for the fourth consecutive month, according to data released by First American Title. Orange County price gains grew by +10.2% in 12 months. By comparison, the #2 and #3 national home price gain leaders were in Miami (+8.9%) and Pittsburgh (+6.5%).

The home value trends in Orange County through July 2024 were as follows:

● Median listing home price: $1.3 million
● Median listing home price per square foot: $704/sq. ft.
● Median sold home price: $1.7 million

2. San Diego, California: In May 2024, home prices in San Diego County surpassed $1 million for the first time ever, as per both the San Diego Union-Tribune and CoreLogic. The total overall price increase of more than 9% year-over-year was the largest spike of any of the Top 10 metropolitan regions in the nation.

With most coastal regions in Southern California now averaging well over $1 million dollars for home prices, a larger number of home buyers are looking at inland regions such as those found in Riverside and San Bernardino counties where some homes can be found at prices closer to the much lower national average.

Low Home Sales Volume

In May 2024, there were 4.11 million home sales, according to the National Association of Realtors. During this same time, there were 3.7 months of available home listing inventory, a median sales price gain of +5.8% year-over-year, and the inventory percentage increase was just up +0.6%.

The May 2024 home sales numbers for the nation dropped to one of the three lowest home sales months over the past decade. The slowest home-selling month was back in May 2020 during the pandemic lockdowns and back in October 2023 when mortgage rates were reaching peak highs.

I can’t think of any other time in U.S. history when near record low sales volume happened as home values reached all-time record highs. Generally, lower sales volume tends to lead to falling home prices.

California’s Top 5 Global Economy

By 2018, California had surpassed the United Kingdom as the 5th largest economy in the world, as measured by Gross Domestic Product, if it were listed as a separate nation.

Listed below are the Top 8 largest world economies as of the end of 2023:

1. United States: $27 trillion (including California)
2. China: $17.7 trillion
3. Germany: $4.4 trillion
4. Japan: $4.2 trillion
5. California $3.86 trillion
6. India: $3.7 trillion
7. United Kingdom: $3.3 trillion
8. France: $3.1 trillion
Source: International Monetary Fund

Now, let’s take a closer look at the Top 5 states for largest output in the nation as of 2023:

1. California: $3.86 trillion
2. Texas: $2.6 trillion
3. New York: $2.2 trillion
4. Florida: $1.6 trillion
5. Illinois: $1.1 trillion


article continues after advertisement


California’s Finite Land Supply

As I’ve shared before in my 2021 article entitled California’s Gold Rush for Valuable Land, there’s a relatively small percentage of available buildable land in the state of California. Values for real estate or other types of consumer goods and services are generally determined by supply and demand. When the demand far exceeds the available supply of an asset or other type of consumer product, the values tend to rise much higher as we’ve seen with California real estate prices.

There are approximately 40 million residents in the Golden State. As of January 2020, the US Census Bureau reported that the US had a population base of 330 million. This translates to California residents representing 12.12% of all US residents.

The famous film and stage actor, writer, and witty humorist from Pacific Palisades, California named Will Rogers once said: “Buy land. They ain’t making any more of the stuff.”

Another historic quote by Harold Samuel, the founder of Land Securities which was one of the United Kingdom’s most successful property companies, about the key to success in regard to how to make money in real estate is as follows: “Location, location, location.”

California is filled with an abundant supply of land that is adjacent to the majestic Pacific Ocean and includes scenic rivers, mountain ranges, and forests up and down the state which borders Mexico, Nevada, Arizona, and Oregon. Our state is 1,040 miles in length and 560 miles in width. There are an estimated 156,000 square miles of land and an additional 7,734 square miles that are covered by water for a grand total size of 164,000 square miles.

If you flew on an airplane between two airports in the state that didn’t fly over the Pacific Ocean, you’d probably see primarily empty land regions. Did you know that our 40 million residents live on approximately just 5.4% of the state’s entire available land supply?

Almost 95% of California has no people living on it due to very strict zoning and usage laws and incredibly high building costs like environmental-impact study and “sustainable living” or green home building fees. The combination of costly environmental-impact fees and rising supply costs are two of the main reasons why there haven’t been many affordable homes or apartments developed in the state.

If we divide 156,000 square miles of available California land supply by the estimated 5.4% of land that’s allowed to have residents living there, this means that only 8,424 square miles of California has residential or commercial real estate and residents on it. If so, this is equal to 4,748 California residents per square mile of the buildable land supply.

Let’s put this 8,424 square miles of buildable land in the Golden State into better perspective by comparing it to other US regions:
● All of the Hawaiian Islands combined: 6,422 square miles
● The Big Island of Hawaii by itself: 4,028 square miles
● The state of Connecticut: 5,543 square miles
● Puerto Rico: 3,515 square miles

California’s Land of Opportunity

For so long as the state’s overall economy remains strong in spite of our massive state deficits, crime, traffic, and lack of affordable housing, we might just see a statewide home price average surpassing $1 million dollars in the near future if our annual home price gains remain at a pace well above our historical average.

Because most of California is not located on a beautiful beach, the fact that many inland properties are also rising to all-time record highs is validation or confirmation that the American Dream is more likely found within California than outside of our state’s borders.


Rick Tobin

Rick Tobin has worked in the real estate, financial, investment, and writing fields for the past 30+ years. He’s held eight (8) different real estate, securities, and mortgage brokerage licenses to date and is a graduate of the University of Southern California. He provides creative residential and commercial mortgage solutions for clients across the nation. He’s also written college textbooks and real estate licensing courses in most states for the two largest real estate publishers in the nation; the oldest real estate school in California; and the first online real estate school in California. Please visit his website at Realloans.com for financing options and his new investment group at So-Cal Real Estate Investors for more details. 


Learn live and in real-time with Realty411. Be sure to register for our next virtual and in-person events. For all the details, please visit Realty411.com or our Eventbrite landing page, CLICK HERE.

Wealth Creation in a Hyperinflationary America

By Rick Tobin

Are we currently experiencing the best economic boom ever with all-time record high stock and real estate prices? Or are more investors moving their weakening dollars into hard assets like real estate, partly as a hedge against skyrocketing inflation trends? Can Quantitative Easing ever end, or have the Federal Reserve and US Treasury created a seemingly infinite hyperinflationary spiral?

Home values have never been higher in many U.S. regions than what we’ve all seen here in 2024. The Dow Jones index also recently reached an all-time peak high of 40,000 and the NASDAQ surpassed 17,000 for the first time ever.

American mortgage holders may now have access to a staggering $11 trillion in tappable equity that’s over and above their existing mortgage balances, according to the May 2024 Mortgage Monitor report from the Intercontinental Exchange (ICE).

The amount of residential property equity is so massive that if all 48 million homeowners spent $10 million of their tappable equity each day, it would take more than 3,000 years to exhaust it, as per ICE. This amount of residential equity available is more money than the Gross Domestic Product (GDP) of Japan, India, and the United Kingdom combined.

The West Coast Gold Rush

The same ICE report identified just five housing markets on the West Coast that represented a quarter of that $11 trillion equity number: Los Angeles, San Francisco, San Jose, San Diego, and Seattle. Four of these five core equity cities are located in the Golden State of California.

As per a study released by Zillow, approximately 20% of our nation’s total housing value is in California. With an estimated 40 million residents in California and upwards of 333 Americans across the nation, the state residents represent close to 12% of all Americans. Yet, our state home values represent a much higher 20% number as compared with the rest of America.

Homeowners usually need income first to qualify for a third-party mortgage to purchase their home. While the cost of living for West Coast residents is typically near the highest in the nation, the salaries paid out by many employers, or the income generated by self-employed workers, is also among the highest in the nation with San Francisco, San Jose, and Seattle ranking first, second, and third nationally for the top average salary, according to CareerBuilder.


article continues after advertisement


The Top 5 Most Unaffordable Housing Regions

Three of the Top 5 most unaffordable housing regions in America are located in Southern California – #1 Los Angeles, #3 Irvine, and #5 Long Beach. Miami was #2 and New York City was #4, as per the RealtyHop Housing Affordability Index for May 2024.

Average families who earned the median income in Los Angeles must now spend a shockingly high percentage of 99.33% of their income on home ownership costs, as discovered in this RealtyHop survey. If true, the average Los Angeles resident would have just 0.67% (or less than 1%) of household income left over to purchase groceries and pay for utilities, automobiles, clothing, home maintenance, and other basic necessities if they were actually able to qualify for a home mortgage with those very high debt-to-income ratios.

Rounding out the Top 20 for the most unaffordable housing cities in America, which included many more California regions, were as follows:

6. Newark, NJ
7. Anaheim, CA
8. San Diego, CA
9. San Jose, CA
10. Boston, MA
11. San Francisco, CA
12. Santa Ana, CA
13. Oakland, CA
14. Chula Vista, CA
15. Fremont, CA
16. Jersey City, NJ
17. Austin, TX
18. Dallas, TX
19. Riverside, CA
20. Seattle, WA

These Top 5 most unaffordable housing regions in the survey compared the median home listing price primarily with the median income for the same region. Let’s take a look below at how high the percentage of household income was needed to cover the project monthly household expenses (mortgage, property taxes, insurance, etc.):

The Top 5 Most Affordable Housing Regions

Now, let’s review the Top 5 most affordable cities in America, which have much lower percentage of income to monthly household payment numbers:

Out of the 100 major cities analyzed by RealtyHop, a whopping 88 of the cities had homebuyers paying more than 30% of their monthly income towards household expenses.

The RealtyHop report findings were based on factors such as the percentage of income required to afford a home, a 30-year fixed mortgage rate of 7.125% (subject to change), and projected household income based on US Census and BEA data.

While there are many cities and towns across the nation with much higher median home values than the Top 5 most unaffordable housing regions listed by Realtyhop, those areas usually had much higher household income averages that helped make the home purchases more affordable.


article continues after advertisement


Income Requirements for Homes by State

Families who live in the five most expensive U.S. states for home purchases require an annual income exceeding $270,000 to live comfortably, according to a report published by Visual Capitalist.

“Comfortable” is defined as the income required to cover a 50/30/20 budget, with 50% set aside for necessities like housing and utilities, 30% for discretionary spending, and 20% allocated for savings or investments, as per the same Visual Capitalist report.

The Top 10 most expensive states for two working adults who are raising two children is listed as follows:

Because home values are so much higher today, the average mortgage balance debt is dramatically rising for many borrowers. One-to-four residential mortgage debt has also reached all-time record highs just north of $20 trillion dollars, as per the St. Louis Fed’s Economic Data.

Investments and Wealth Creation

“If you don’t find a way to make money while you sleep, you will work until you die.” – Warren Buffett

If you’re fortunate to own assets, your net worth is probably rapidly increasing. If not, the declining purchasing power of the dollar is making it very challenging for tens of millions of Americans to pay their bills on time.

There’s another old saying that is somewhat similar to Mr. Buffett’s quote that’s as follows: “Either you work hard for your money or your money works hard for you.”

Our towns, cities, states, and our nation are spending money like never before in U.S. history. The federal government continues to increase our debt at a pace of close to $1 trillion dollars every 90 days.

Between January 2020 and October 2021, the M1 money supply (cash or cash-like instruments) grew from $4 trillion to $20 trillion as I’ve written before. The more money that is created and the larger our federal debt grows and compounds, the weaker the purchasing power of the dollar.

For those people who don’t own any real estate or stocks, they are not experiencing firsthand the record wealth being created for many Americans.

Inflation is more likely than not to grow at a faster pace in the near future than what we’ve seen over the past 50 years or so. If so, real estate has proven to be an exceptional hedge against inflation as properties tend to appreciate on a historical average at least as high as the published annual inflation rates.

If you’re lucky enough to own one or more properties today, then you might consider pulling some equity out of the home to acquire more income-producing assets. For first-time homebuyers, today may be the best time to start looking for properties.

A home near you that you consider to be “too expensive” might seem very reasonable five years from now as inflation keeps rising and our dollar gets weaker and weaker.


Rick Tobin

Rick Tobin has worked in the real estate, financial, investment, and writing fields for the past 30+ years. He’s held eight (8) different real estate, securities, and mortgage brokerage licenses to date and is a graduate of the University of Southern California. He provides creative residential and commercial mortgage solutions for clients across the nation. He’s also written college textbooks and real estate licensing courses in most states for the two largest real estate publishers in the nation; the oldest real estate school in California; and the first online real estate school in California. Please visit his website at Realloans.com for financing options and his new investment group at So-Cal Real Estate Investors for more details. 


Learn live and in real-time with Realty411. Be sure to register for our next virtual and in-person events. For all the details, please visit Realty411.com or our Eventbrite landing page, CLICK HERE.

Unaffordable Housing, Taxation, and Consumer Debt Trends

By Rick Tobin

The purchasing power of the dollar continues to rapidly decline, sadly. This weakening dollar trend hasn’t just happened in recent years. Rather, it’s been going on since the formation of the Federal Reserve back in 1913. One dollar in 1913 now has the equivalent purchasing power of about 2 cents today.

Yet, the purchasing power has rapidly decreased at a seemingly accelerated pace since 2020 when the worldwide pandemic declaration began.

As per a home unaffordability study shared by Redfin and Visual Capitalist on April 4, 2024, an “unaffordable” home is defined as a new listing with a monthly mortgage payment that is no more than 30% of the median monthly income in its county.


article continues after advertisement


Here are the findings from this unaffordability report:

  • Only 16% of U.S. homes for sale were affordable in 2023, which was an all-time record low.
  • By comparison in 2021, 39% of listed properties were considered affordable.
  • With just 0.3% of home listings deemed affordable, Los Angeles has the lowest share of affordable listings in America.
  • By contrast, Detroit had the highest share of affordable listings with over 51% of homes.

Let’s take a look at how the unaffordable housing numbers have rapidly fallen over the past 10 years:

2023 16%
2022 21%
2021 39%
2020 45%
2019 40%
2018 37%
2017 42%
2016 45%
2015 45%
2014 46%
2013 50%
Source: Redfin and Virtual Capitalist

The Top 20 Most Unaffordable Cities

Seventeen of the top 20 most unaffordable U.S. cities to buy a home are located in either the counties of Los Angeles, Orange, or San Diego in Southern California. The other three cities are in Northern California. This is a national study created by the real estate tracking agency Construction Coverage, not just for California.

This data report compiled by Construction Coverage took a closer look at cities of all sizes, while focusing on the ratio of home prices to household income as the core basis for determining how affordable a region is these days.

The Top 3 most unaffordable cities in this study were as follows:

1. Newport Beach, CA: Median home price of $3.23 million; median household income of $127,353; and a home price-to-household income ratio of 25.4.

2. Palo Alto, CA: Median home price of $3.41 million; median household income of $179,707; and a home price-to-household income ratio of 19.

3. Glendale, CA: Median home price of $1.17 million; median household income of $77,483; and a home price-to-household income ratio of 15.2.

There are many regions across the nation with median home prices much higher than these Top 3 unaffordable housing regions. However, those regions generally have much higher household income to make the home price-to-household income much lower.

The California cities in the top 20 of the report are:
1. Newport Beach
2. Palo Alto
3. Glendale
4. Los Angeles
5. El Monte
6. Costa Mesa
7. El Cajon
8. Inglewood
9. Hawthorne
10. Sunnyvale
11. Irvine
12. Huntington Beach
13. Torrance
14. Garden Grove
15. San Jose
16. Anaheim
17. Long Beach
18. East Los Angeles
19. Carlsbad
20. Tustin


article continues after advertisement


States With the Highest Home Price-to-Income Ratios

Toughest Regions to Save Money

The national personal savings rate has dropped from record highs of over 20% in 2020 and 2021 to 3.8% as of January 2024, according to Forbes. Many Americans these days couldn’t come up with $400 in cash for an unexpected emergency, partly due to rising grocery, gas, utilities, housing (own or rent), clothing, restaurant, entertainment costs, and how high or not the state income taxes are there.

Let’s focus on how high certain foods have risen since 2019 to better understand why things seem so much more unaffordable these days:

1. Cocoa: +345%
2. Orange juice: +260%
3. Olive oil: +219%
4. Sugar: +120%
5. Fruit snacks: +77%
6. Cooking oil: +54%
7. Chocolate bars: +52%
8. Apple sauce: + +51%
9. Beef: +51%
10. Mayonnaise: +50%
Source: The Kobeissi Letter

The Riverside-San Bernardino-Ontario metropolitan area is ranked as the #1 most challenging place in America to save money with the Los Angeles-Long-Anaheim metropolitan region ranking second.

The list of America’s hardest metropolitan regions areas to save money in is listed below:

1. Riverside-San Bernardino-Ontario
2. Los Angeles-Long Beach-Anaheim
3. Miami-Fort Lauderdale-Pompano Beach, FL
4. New York-Newark-Jersey City, NY-NJ-PA
5. Atlanta-Sandy Springs-Alpharetta, GA
Sources: Forbes Advisor and KTLA

The top ten most difficult states to save money in can be viewed below:
1. California
2. Hawaii
3. Nevada
4. Oregon
5. Maryland
6. Florida
7. New York
8. South Carolina
9. Colorado
10. Louisiana
Source: Forbes Advisor and KTLA

Rental housing changes: According to data shared by Zillow and NerdWallet, the average U.S. rent was $1,958 in January 2024. This is +29.4% more expensive than before the pandemic declaration in March 2020.

Rising Taxation Risks

Our federal government debt surpassed $34 trillion earlier this year. It’s now growing at a pace of an additional $1 trillion every 90 days, which is an annual new debt pace of $4 trillion per year. For comparison purposes, it took 10 years for the federal debt to increase by $2 trillion between 1980 and 1990.

The White House is seeking to raise another $5 trillion in tax revenues starting next year in 2025 to help offset the increasing size of our budget deficits. For real estate investors, you and your tax advisors should stay focused on these proposals that may more than double the capital gains rate and possibly eliminate the 1031 tax-deferred exchange option, which helps to defer capital gains taxes over a much longer period of time.

If this 2025 budget proposal is enacted, California residents will be looking at upwards of a 59% federal-state capital gains income tax rate starting in 2025. It also may make significant negative changes to the “death tax” for heirs. Don’t be surprised if Americans start selling assets here in 2024 on a larger scale to avoid these much higher capital gains taxes next year.

Additionally, the White House’s 2025 budget proposal includes the creation of a minimum tax equal to 25% of an individual’s taxable income and unrealized capital gains for assets that weren’t even sold for certain higher income people, as per multiple sources including Quoth The Raven.

The combination of increasing all types of taxes (state, federal, capital gains, and possible unrealized tax gains) plus the potential elimination of the 1031 tax-deferred exchange for rental properties will hurt real estate values at some point.

All-Time Record Credit Card

Credit card and overall consumer debt are at all-time record highs along with the total rates and fees (APRs). Credit card defaults are now at the highest level ever or at least since 2012, when the Fed started tracking this data.

Average APRs are fluctuating between 27% and 33% these days for many consumers. It wasn’t that long ago when credit card APRs were closer to 12% about 10 years ago or so.

All stages of credit card delinquency (30, 60, and 90+ days) rose during the fourth quarter of 2023, according to data shared by the Federal Reserve Bank of Philadelphia.

Freddie Mac Bailouts for 2nds

Freddie Mac may soon start purchasing funded home equity lines of credit (HELOCs) in the secondary market, as per multiple sources including HousingWire.

A new multi-trillion dollar stimulus package of up to $2 trillion is being prepared, by way of the government-backed Freddie Mac entity, so that it’s easier for banks and mortgage companies to offer 2nd loans, which will then be quickly sold off to Freddie Mac.

In recent years, a larger number of banks and mortgage companies stopped offering HELOCs due to the perceived risk, especially for liens in 2nd position. If lenders may soon be able to quickly unload the funded HELOCs over to Freddie Mac, they may be inspired to offer these types of riskier loans again.

Whether it’s a federal bailout of lenders, homeowners, small businesses, billion-dollar corporations, or consumers drowning in credit card or student loan debt, all of these actions are inflationary and will likely make the dollar weaker and weaker.

Because government spending is likely to keep exceeding all-time record highs, these inflationary actions may help boost real estate values that are generally hedged against inflation.

Please try to pay off any double-digit consumer debt, set aside cash for you and your family if possible, and keep your eyes wide open for potential discounted real estate bargains in a neighborhood near you.


Rick Tobin

Rick Tobin has worked in the real estate, financial, investment, and writing fields for the past 30+ years. He’s held eight (8) different real estate, securities, and mortgage brokerage licenses to date and is a graduate of the University of Southern California. He provides creative residential and commercial mortgage solutions for clients across the nation. He’s also written college textbooks and real estate licensing courses in most states for the two largest real estate publishers in the nation; the oldest real estate school in California; and the first online real estate school in California. Please visit his website at Realloans.com for financing options and his new investment group at So-Cal Real Estate Investors for more details. 


Learn live and in real-time with Realty411. Be sure to register for our next virtual and in-person events. For all the details, please visit Realty411.com or our Eventbrite landing page, CLICK HERE.

Will the Realtors®’ Commission Settlement Impact You?

By Rick Tobin

The biggest purchase of a person’s life for the average American is their primary home where they live. Later in life, the equity in this same owner-occupied home will likely represent the bulk of the homeowner’s entire net worth.

A wise purchase can make you very wealthy, while an unwise purchase can be financially devastating. Would you prefer to take this risk alone or with a team of experienced professionals by your side?


article continues after advertisement


How many of you have seen how thick a real estate purchase and mortgage file can be at the time of closing? I’ve seen files for residential or commercial real estate loans that were three, six, twelve, and twenty-four plus inches thick by the time of closing. Could you imagine handling the closing of a purchase transaction without the expert assistance provided by real estate licensees, mortgage brokers, loan processors, underwriting teams, escrow, title insurance, appraisers, home inspectors, and several others?

As a result of the recent $418 million dollar anti-monopoly lawsuit settlement that the National Association of Realtors® (NAR) approved, let’s take a closer look at how these new buyer agency relationship regulations may directly impact you as a buyer or seller.

The potential reduction of brokerage commissions

The potential elimination of buyer’s agents from a larger percentage of future sales transactions will obviously hurt many real estate licensees. Prior to this NAR settlement, the average commission paid per real estate transaction was about 5.5%. It can be split evenly at 2.75% to the listing agent and 2.75% to the buyer’s agent or with more of the commission split going to the listing agent such as 3% for list agent and 2.5% for the buyer’s agent. Will future commission splits fall to lower amounts?

There are upwards of 1.5 million Realtors® who belong to NAR and about 500,000 additional real estate licensees who don’t belong to NAR for a grand total of nearly 2 million real estate licensees.

Upwards of 80% of real estate licensees (about 1.6 million) own at least one home. With the future loss of income from discounted or eliminated buyer’s brokerage fees, many of these real estate licensees may be forced to list their home for sale while pushing the national home listing inventory rates higher.

Generally, the buyer’s agent does the most work in a real estate transaction because they tend to interact with almost every party involved in the transaction (listing agent, mortgage broker or banker, escrow, attorney, and/or title insurance, appraiser, home inspectors, environmental specialists, etc.). Wouldn’t the elimination of a buyer’s agent be problematic for many transactions across the nation?


article continues after advertisement


How will first-time buyers afford to buy their buyer’s agent directly?

The average first-time homebuyer invests approximately 6% of the purchase price. For all homebuyer types (move-up, 2nd home, investor, etc.), it’s closer to 13% nationwide and as high as 18% here in California.

VA (Veterans or active military personnel) homebuyers are not allowed to pay buyer’s agent fees. Most of them qualify with no money down 100% LTV loans. FHA buyers usually come in with somewhere between 0% and 3.5% down. Many times, FHA home buyers do not have any extra cash to pay their buyer’s agents directly.

If homebuyers are now expected to find and hire their own buyer’s agent and pay them anywhere between 1% and 3%, it will be very challenging for many homebuyers to come up with the additional funds to pay their buyer’s agent directly and purchase their dream home.

Commissions and seller credit negotiations

Commission fees for the listing agent and buyer’s agent have always been negotiable. This new NAR settlement doesn’t change that option. Yet, it makes it more challenging for buyers, sellers, and real estate licensees to complete a transaction.

If a buyer prospect signs a buyer’s agency agreement with a real estate licensee for 2% and the seller or new home builder offers to pay 3% to the buyer’s agent, then can the buyer’s agent be paid the higher 3% commission offered by the seller or is the commission amount limited by the 2% fee mutually agreed to by the buyer and buyer’s agent? For licensees, this is a topic to be discussed with your employing broker and/or advising legal experts.

Many times, a purchase deal is structured with seller credits that cover the buyer’s agent and listing agent fees and overall closing cost credits (loan, escrow, title, inspection, and/or appraisal fees), which may vary between 5% and 10% of the total purchase price. Without these seller credits, the buyers may not have enough of their own funds to cover the required down payment and closing costs with or without being required to pay their own buyer’s agent.

The rise of dual agency, attorney closings, and self-represented deals

This NAR case settlement may set a legal precedent for future courtroom cases to completely outlaw dual agency where one licensee represents both the buyer and seller. I’ve written real estate courses in more than 30 states over the years and have held eight different real estate, mortgage, and securities brokerage licenses, so I’m somewhat familiar with the fact that many states already outlaw dual agency.

Many legal groups are behind the push to eliminate real estate licensees so that lawyers handle a higher percentage of closings like they do in New York state and elsewhere. Attorneys like to say that dual agency for Realtors® is akin to an attorney unfairly representing both sides in a lawsuit.

A buyer’s agent is focused on protecting their buyer more than any other licensed or unlicensed professional involved in a purchase transaction. Why would so many people be happy to eliminate the main party who is truly working in the buyer’s best interests?

Contingency dates and disclosure risks

Real estate contracts and inspection reports are incredibly complex. A buyer or seller who attempts to represent themselves in a purchase contract may miss important contingency dates for the completion of the appraisal, home inspection reports, or formal mortgage approval and lose their 1% to 3%+ in earnest money deposits.

Sellers, in turn, who don’t fully disclose all known or potential home and environmental risks to their buyers may later be subject to multi-million dollar lawsuits related to mold, cracked foundations, leaky roofs, or toxic air from a nearby chemical plant. The seller’s $300,000 home price sales gain later turns into a – $1.7 million dollar loss after the $2 million dollar court judgment is filed for not clearly disclosing all known or potential risks.

The median U.S. home sales price is at or just below $400,000. The average buyer’s brokerage commission fee is 2.5% or about $10,000. A buyer who is self-represented may pay too much for the home at prices well above $10,000 and put themselves at greater risk for missing out on the disclosure risks that could later cost them tens or hundreds of thousands of dollars.

A future lawsuit against the seller may net them zero if the seller files for bankruptcy protection unless fraud can be proven. The buyer still may collect zero from a recorded judgment if the seller has no assets.

For more successful real estate licensees who can afford a rather large marketing and networking budget while controlling a high percentage of the listings in their region, how many buyers’ agents will show your listing if there’s no buyer’s agent commission being offered by the seller? Why would someone work for free and take on such significant risk for nothing?

Mortgage brokers who hold a real estate broker’s license like me could step in and write up the purchase contract, negotiate the seller credits, and bring in the money to close it. Yet, why would I want to double my workload if I act as the buyer’s agent to collect no additional commission and significantly increase my liability risks? In many of my purchase deals, I value the assistance provided by the buyer’s agent more than any other professional.

Will home values be impacted by new agency regulations?

The real estate sector represents upwards of 20% of the national economy. For people who don’t hold real estate licenses, they may still be directly impacted as future home inventory numbers possibly rise and property values start to decline. As foreclosures rapidly increase, these become the neighborhood sales comps that either hurt or help your home value.

Some in the media are claiming that this buyer’s agency commission reduction or elimination will be very good for homeowners. Again, the average buyer’s brokerage commission is closer to 2.5% than 2.75% or 3%, yet I will increase it to 3% for the average $800,000 home sales price in California to arrive at an alleged $24,000 commission savings for the buyer and/or seller.

If home prices fall just 5% in California due solely to these massive Realtor® regulation changes, that’s equivalent to a $40,000 price reduction for the seller. If so, the seller is now losing $16,000 in gains ($40,000 – $24,000 = $16,000 in total losses) with just a 5% reduction in sales prices in spite of paying no buyer’s agent commission fee on a typical $800,000 home sales transaction. What happens if home prices fall 10%, 20%, or more?

The rise in mortgage rates, insurance costs, utilities, and overall skyrocketing inflation rates will also inspire more homeowners to list and sell. Real estate prices are influenced the most by the old economic theory known as supply and demand, for better or worse.

As more and more residential and commercial property go underwater or upside-down (mortgage debt exceeds value), how will buyers or sellers be able to handle the complex process of forbearance, pre-foreclosure, or short sale discounts on their own without the help of an experienced advisor?

To learn more details from the perspective of the National Association of Realtors®, here’s an informative post that’s entitled The Truth About the NAR Settlement Agreement.

Whether you’re in favor of this NAR settlement agreement or hate it, please research as many different sides of this topic to better understand how it may help or harm you as a buyer, seller, landlord, tenant, real estate licensee, or third-party professional.


Rick Tobin

Rick Tobin has worked in the real estate, financial, investment, and writing fields for the past 30+ years. He’s held eight (8) different real estate, securities, and mortgage brokerage licenses to date and is a graduate of the University of Southern California. He provides creative residential and commercial mortgage solutions for clients across the nation. He’s also written college textbooks and real estate licensing courses in most states for the two largest real estate publishers in the nation; the oldest real estate school in California; and the first online real estate school in California. Please visit his website at Realloans.com for financing options and his new investment group at So-Cal Real Estate Investors for more details. 


Learn live and in real-time with Realty411. Be sure to register for our next virtual and in-person events. For all the details, please visit Realty411.com or our Eventbrite landing page, CLICK HERE.

Inflation, Home Price Swings, and Wealth Distribution

By Rick Tobin

Between January 2020 and October 2021, the M1 money supply (cash or cash-like instruments) quickly rose from $4 trillion up to $20 trillion in just 22 months. Money velocity, or money creation speed, is the true root cause of rapidly declining purchasing power and skyrocketing inflation. The more money in circulation, the less purchasing power for the dollar.


article continues after advertisement


In January 2024, Americans were paying $213 per month more to purchase the same goods and services one year earlier in 2023 because of rising inflation and the declining purchasing power of the dollar. As compared with two years ago in 2022, Americans are paying $605 more per month. Sadly, we’re now paying $1,019 more PER MONTH ($12,228 more per year) today for the same goods and services we purchased three years ago in 2021.

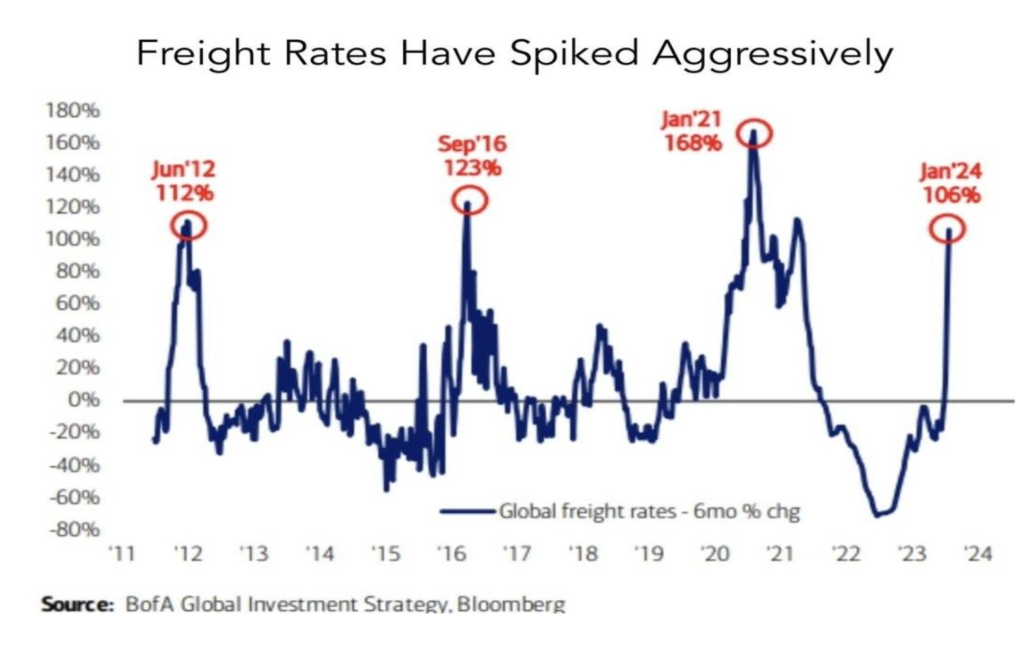
Shipping, trucking, and other transportation costs are quickly rising amid geopolitical tensions. Historically, increasing transportation and energy costs are a root cause of inflation trends. Don’t be surprised if inflation rates and interest rates are both higher later this year instead of lower.

Home Value-to-Income Ratio in the U.S.

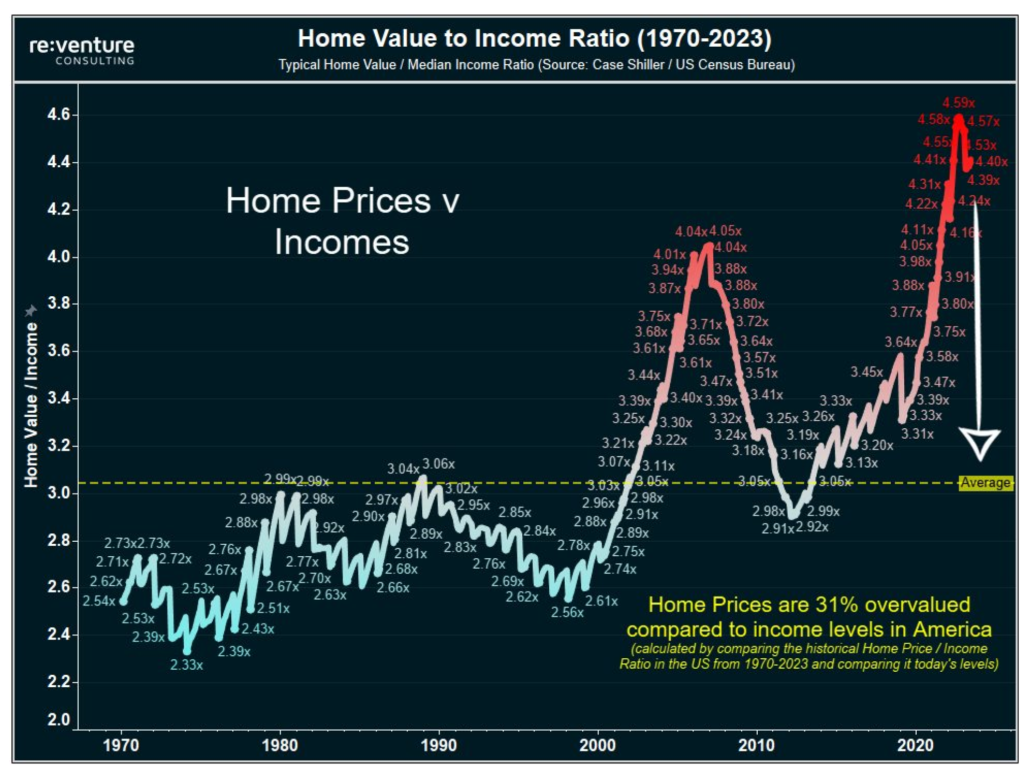
The U.S. home value-to-income ratio is calculated by dividing the $342,000 median home value by the $74,580 median household home, according to Economy Vision. If home prices had grown at the same rate as income since 2000, the median U.S. home would cost nearly $294,000, or 31% to 32% lower than today’s prices.

U.S. households need an average income of $166,600 to afford a home, but the median household income is $74,580. The lowest home price-to-income ratios in large metropolitan regions are in Pittsburgh (3.2x), Buffalo (3.5),and Cleveland (3.5), while many California regions are near 10 to 20x. Some smaller suburban or rural regions in Southern Illinois and other Midwest regions are closer to 1.5 to 1.8 for home price-to-income ratios.

Increasing Distressed Residential and Commercial Mortgage Numbers

Millions of Distressed Residential Mortgages

The federal government keeps extending the millions of distressed FHA and VA loans, or offering discounted loan modifications, partly so that they don’t push the national home listing supply skyward and reduce home prices at the same time.

The C-19 foreclosure or forbearance moratoriums for millions of FHA and VA borrowers began back in the fall of 2020. As a result, many of these home borrowers haven’t made a mortgage payment for more than three years.

The FHA forbearance moratoriums for FHA borrowers expired on November 30, 2023 while the VA forbearance moratoriums were extended until May 31, 2024. At some point, these loans will need to be brought back current, sold, or foreclosed.

In the previous housing crash that was especially bad during 2008 to 2012, only about 2% (or 1 in 50 mortgages) of all residential loans were delinquent. Yet, these distressed home mortgages became future lower value comps for the nearby homes while driving their prices downward too, sadly.

If and when the national home listing supply numbers rapidly increase this year, it will eventually have a negative impact on home price trends because it’s all supply-and-demand economics at the true core. When supply of a product or asset rises and exceeds buyer demand, then prices tend to fall (and vice versa).

Concerning Commercial Mortgage Trends

An estimated 44% of office buildings nationwide with mortgages in place are claimed to be upside-down with negative equity here near the start of 2024. Some office buildings are selling for as low as $9 per square foot, not $900/sq. Ft. By the end of 2024, the underwater office building numbers may be well over 50% and the overall underwater or upside-down numbers for all commercial property types may be somewhere within the 20% to 25% range.

Physical and Online Retail Store Numbers

  • In Q3 2023, the amount of U.S. retail space available for lease plunged to an all-time low since the CoStar commercial real estate group started tracking back in 2007.
  • The previous seven years in a row (2017 – 2023) shattered all-time retail space closings per square foot in U.S. history.
  • Through just September 2023, 73 million square feet of retail space closed in 2023, as per Coresight.
  • 140 million square feet of retail space has been demolished in the last decade, according to CoStar.
  • Top 6 online sales percentages in 2023: 1. Amazon (37.6%); 2. Walmart (6.4%); 3. Apple (3.6%); 4. eBay (3%); and 5. Target and Home Depot (a tie at 1.9% each), per Statista.
  • 10.4% of total annual U.S. retail sales were online in 2017;
  • 12.2% of total annual retail sales were online in 2018;
  • 13.8% of total annual retail sales were online in 2019;
  • 17.8% of total annual retail sales were ecommerce in 2020;
  • 18.9% of total annual retail sales were ecommerce in 2021; &
  • 18.9% of total retail sales were online in 2022, per Statista.
  • The full 2023 online year results weren’t published yet.

Record-High Car Payments

Some new monthly car payments are reaching $3,000 per month, while average new car payments are near $730 to $750 per month. Additionally, many monthly car insurance payments are reaching $400 to $500 per month in cities like Detroit and Philadelphia. How much are these car owners paying in gas and maintenance as well?

The national average cost for car insurance rose a whopping +26% from last year, according to Bankrate.

The most expensive cities for car insurance are:

Detroit – $5,687
Philadelphia – $4,753
Miami – $4,213
Tampa – $4,078
Las Vegas – $3,626

The cheapest cities are:

Seattle – $1,759
Portland – $1,976
Minneapolis – $2,044
Boston – $2,094
Washington D.C. – $2,430

The average car loan today is valued at 125% LTV (loan-to-value) for the typical car on the road with a loan with an average negative equity balance of -$6,000. This is partly because so many car buyers are purchasing cars with no money down and adding their registration, licensing, taxes, and warranty fees on top of it before driving off of the car lot. New cars usually drop in value about 20% in the very first year of purchase.


article continues after advertisement


Inflationary or Deflationary Economic Cycles

Inflation has been described as an increase in the general level of prices of a certain product in a specific type of currency. Inflation can be measured by taking a “basket of goods,” and then comparing them at different periods of time while adjusting the changes on an annualized basis.

General inflation measures the value of a currency within a certain nation’s borders, and refers to the rise in the general level of prices. Currency devaluation measures the value of currency fluctuations between different nations. Some related terms associated with inflation are as follows:

* Deflation is a rise in the purchasing power of money, and a corresponding lowering of prices for goods and services. The Fed doesn’t like this economic period of time and will probably cut short term rates to offset it.

* Disinflation refers to the slowing rate of inflation. The Fed may like this type of economic time period, and may stop raising rates at this point in the economic cycle.

* Reflation is the period of time when inflation begins after a long period of deflation. Depending upon the severity of inflation, the Fed may pause the rate hikes or gradually begin rate hikes.

* Hyperinflation is rapid inflation without any tendency toward equilibrium. It is inflation which compounds and produces even more inflation. It is when inflation is much greater than consumers’ demand for goods and services. The Fed, and the rest of America, do not typically like this economic period, so they may enact a series of significant rate hikes to slow inflation.

The Wealth Distribution Imbalance

Wealth distribution across the U.S. has become increasingly concentrated in the hands of fewer people since 1990. Overall, the top 10% of wealthiest Americans own more than the bottom 90% combined, with more than $95 trillion in wealth for the top 10%.

Here in 2024, the share of wealth held by the richest 0.1% is near its peak with a minimum of $38 million in wealth in just 131,000 households.

With $20 trillion in wealth, the top 0.1% earn an average of $3.3 million in income each year. The greatest share of the wealth owned by the top 0.1% is held in corporate equities or stocks and in mutual funds, which make up over one-third of their total assets.

Households in the lower-middle and middle classes as found in the 50% to 90% income and asset brackets are claimed to have a minimum of $165,000 in wealth held primarily in real estate and followed by pension and retirement benefits.

Unless you’re in the Top 0.1%, the odds are quite high that the bulk of your wealth is concentrated in real estate if you’re fortunate enough to own at least one property today. In our next meeting, we will discuss how to find discounted real estate and other investments and how insurance and estate planning can help protect your assets for you and your family.

Extreme Rate Swings, Steady Home Gains

Between 2000 and 2023, the median U.S. home appreciated approximately 10.63% per year. By comparison, California homes rose 12.55% per year between 2000 and 2023.

Doubling Value Forecasts: The Rule of 72 is an investment formula used to estimate how long it may take for an asset to double in value using a projected annual rate of return (72/7 or 7% = 10+years).

A home purchased using the national average annual gain of 10.63% would double in value in just over 6.77 years if purchased this year (72/10.63 = 6.77 years). A California home would double in just 5.74 years (72/12.55) if these same average annual appreciation gains continued.

Home prices tend to go skyward following a Fed pivot when they start slashing rates. When will the Federal Reserve start cutting rates again? Let’s take a look at their calendar for 2024 two-day meeting dates: Jan. 30-31 (no rate change); March 19-20; April 30- May 1; June 11-12; July 30-31; Sept. 17-18; Nov. 6-7; & Dec. 17-18.

Inflation severely damages the purchasing power of the dollar while usually boosting real estate values. Because it’s more likely than not that inflation will continue rising above historical average trends, then real estate may be one of your best hedges against inflation as your wealth compounds and increases as well.

Rates may be lower, the same, or higher by the end of 2024, partly due to our volatile inflation movement and weakening dollar. However, there’s a tremendous upside for real estate investors if you’re willing to stay focused on the opportunities and not let the negative news scare you away.


Rick Tobin

Rick Tobin has worked in the real estate, financial, investment, and writing fields for the past 30+ years. He’s held eight (8) different real estate, securities, and mortgage brokerage licenses to date and is a graduate of the University of Southern California. He provides creative residential and commercial mortgage solutions for clients across the nation. He’s also written college textbooks and real estate licensing courses in most states for the two largest real estate publishers in the nation; the oldest real estate school in California; and the first online real estate school in California. Please visit his website at Realloans.com for financing options and his new investment group at So-Cal Real Estate Investors for more details. 


Learn live and in real-time with Realty411. Be sure to register for our next virtual and in-person events. For all the details, please visit Realty411.com or our Eventbrite landing page, CLICK HERE.

How to Minimize Risks and Maximize Gains

By Rick Tobin

Between January 2020 and present day, U.S. home prices rose a staggering +47%, per S&P CoreLogic Case-Shiller. Are these price trends likely to keep rising at the same pace or not?

How is it possible that the reported published inflation rates are declining while home prices and home unaffordability rates are increasing at the same time?

Will home prices decrease, flatten, or increase later here in 2024? The answer partly depends on whether the home listing inventory supply rapidly increases or decreases. It’s all supply and demand economics at the true core.


article continues after advertisement


Let’s take a closer look at some eye-opening housing, inflation, and jobs numbers:

  • Before the Fed started raising rates in 2022, a $2,000 monthly housing budget would have bought a home costing more than $400,000. Today, a $2,000 monthly household budget gets $295,000 or less.
  • Existing home sales between 1998 and 2007 averaged 6 million per year. Through October 2023, the annual home selling pace was closer to 3.79 million housing units.
  • Over the past 50 years (1973 – 2023), home prices rose by nearly 1,300% as compared with a 610% gain in the CPI (Consumer Price Index).
  • The inflation-adjusted hourly work wage has increased by just a measly 1% over the past 50 years (not an annual 1% increase, but just a 1% total gain over and above 1973’s wages in 2023 at a 1/50th of 1% increase per year average).
  • By comparison, the inflation-adjusted median home price has gained 100% over the past 50 years. As a result, real home prices have increased by more than 100 times (or 100x) the real wage gains.

Sources: CPI, Federal Reserve, and ZeroHedge

To be able to afford the median-priced home of $433,100 in late 2023, a household needed an annual income of roughly $166,600. However, the median household nationwide earns just $74,580, which is only 45% of the recommended amount.

By comparison, the median-priced home in California reached almost $860,000 in recent months. This is almost double the national median-priced home average.

As it relates to the lock-in effect, it does not matter too much if the homeowner’s mortgage rate is 6%, 4%, or 2% if they lose their job and main source of income. Foreclosures will likely rapidly increase this year as the true unemployment numbers skyrocket, sadly. It then creates a downward spiral for the neighboring homeowners as future foreclosures become the latest sales comps while creating more upside-down homes with negative equity. Later, more underwater homeowners will walk away if they have no equity to protect.

The latest house payment ($62,165) as a percentage of household income ($94,964) number ratio is 65.46% here in California ($62,165/$94,964 = 65.46%).

Approximately 60% of all homes owned in America are owned by people over the age of 50. Average home prices across the nation have increased 45%+ since the pandemic declaration back in March 2020. At some point, more older Americans will likely list their homes for sale to take their gains and to downsize at the same time while pushing the home listing inventory numbers higher.

If you have cash or access to third-party loans or equity partners, there will be some incredible buying opportunities this year and beyond.

Water Damage and Extreme Weather Swings

It’s getting increasingly difficult to obtain insurance for both owner-occupied and rental properties. A mortgaged residential or commercial real estate property is required to have sufficient amounts of insurance coverage, or the lender may consider it to be the equivalent of a mortgage default that would later lead to a foreclosure filing.

The #1 cause of damage to homes is usually excess water from rainstorms, heavy snowfall, floods, leaky roofs, or broken pipes. Fewer than 2% of Californians have flood insurance coverage for their homes. The horrific flooding in San Diego last month will likely cause significant losses for residential and commercial real estate properties as well as push insurance premiums skywards for local San Diego County and statewide residents.

Florida is #1 for the highest annual homeowners insurance premiums that are near $9,270. How much worse will it get after hurricane season begins?

Please make sure that you have multiple insurance coverage options from your preferred insurance broker just in case you receive a cancellation notice in your mailbox in the near future.

Commercial Real Estate

Upwards of 44% of office buildings nationwide with a mortgage are now claimed to be upside-down with negative equity here near the start of 2024. Later this year, the negative equity numbers should keep rising. How will this potentially impact banks and the overall US economy later this year and next?

CNBC recently published this article entilted vacant office spaces on the rise, with over 100 million square feet available in Manhattan.

This 100 million square foot number is equivalent to 40 vacant Empire State Buildings. Occupancy rates for office buildings in that region continue to remain under 50%. How many of these empty offices will later be converted to residential units?

Blackstone, the world’s largest owner of commercial real estate and a spinoff of BlackRock, is walking away from some of their distressed and upside-down commercial properties.

Year-over-year office building price percentage losses (’22 – ’23)
1. San Francisco: -58.9%
2. Chicago: -48.3%
3. San Jose: -48.0%
4. Philadelphia: -45.1%
5. Los Angeles: -44.6%
6. Orange County, CA: -38.4%
7. Dallas/Ft. Worth: -37.6%
8. New York: -37.3%
9. Austin: -31.5%
10. Boston: -24.2%

Source: Green Street News (data for all office sales, not just for Blackstone deals)

There are another one million new rentals coming to market by 2025 over and above the 1.2 million new apartment units that were built over the past three years, according to REjournals. Will this drive down rental prices even more due to excess supply?

Banks

Between 2017 and 2023, more than 10,000 bank branches closed nationwide. From January 1, 2023 through October 19, 2023, banks fired 20,000 employees. Yet, an additional 42,000 bank employees were let go in the final 72 days of the year between October 20th and December 31st for a grand total of 62,000 bank layoffs in 2023. Will these numbers accelerate in 2024?

Next month on March 11th, the Federal Reserve is terminating their “safety net” for many banks that’s called the Bank Term Funding Program (BTFP). After the financial system almost collapsed last year in March 2023, it was the BTFP bailout programs that possibly prevented bank runs after many banks became technically insolvent. On March 12th, private money may become quite popular as a backup lending solution because fewer banks may be able to lend to even their most creditworthy clients.

The banking dominoes continue to fall…

The push towards the “Basel III Endgame” banking regulation, which requires banks with assets over $100 billion to set aside more capital or cash reserves while driving down their ability to lend, is almost here.

Basel is a reference to the city in Switzerland where the world’s superbank, named the Bank for International Settlements, is located. They govern all central banks worldwide, including the Federal Reserve. We may see an increasing number of bank closures and mergers this year and next, partly due to these new regulations.


article continues after advertisement


China’s Defaulting Real Estate Marketplace

Here comes the next potential Asian Contagion event and derivatives debt tsunami from Evergrande (3333.HK stock symbol – they were once China’s largest real estate developer) as I’ve been writing about for several years. Country Garden, also ranked as high as the #1 largest real estate developer in China, is having their own serious financial challenges as well. It could force many Chinese investors to sell off their US Treasury holdings, which, in turn, may drive the 10-year Treasury yield and corresponding 30-year fixed mortgage rates higher.

January 2024 was somewhat reminiscent of the Russian financial crisis (stocks, bonds, and currency implosions) that spread to Asia (aka Asian Contagion) and South America back in 1998. At the same time, the derivatives investments held by Long-Term Capital Management (LTCM) were so volatile and at risk that they ran out of money while almost taking down the world’s entire financial system at the same time.

Several large financial institutions were asked by the Federal Reserve to put upwards of $100 million each to save LTCM’s derivatives bets so that the financial system wouldn’t collapse. The only investment firms that refused to bail out LTCM in 1998 were Lehman Brothers and Bear Stearns. Ten years later in 2008, they were the first big investment firms to implode as the Credit Crisis (primarily related to a frozen global derivatives market) worsened and were not bailed out either, ironically.

Never forget that the global bond and currency markets absolutely dwarf all stock markets combined. Get your popcorn ready and keep a close eye on financial institutions in China, Russia, Germany (Deutsche Bank, especially), and here in the U.S.

Jobs Layoffs and Declining Cash Reserves

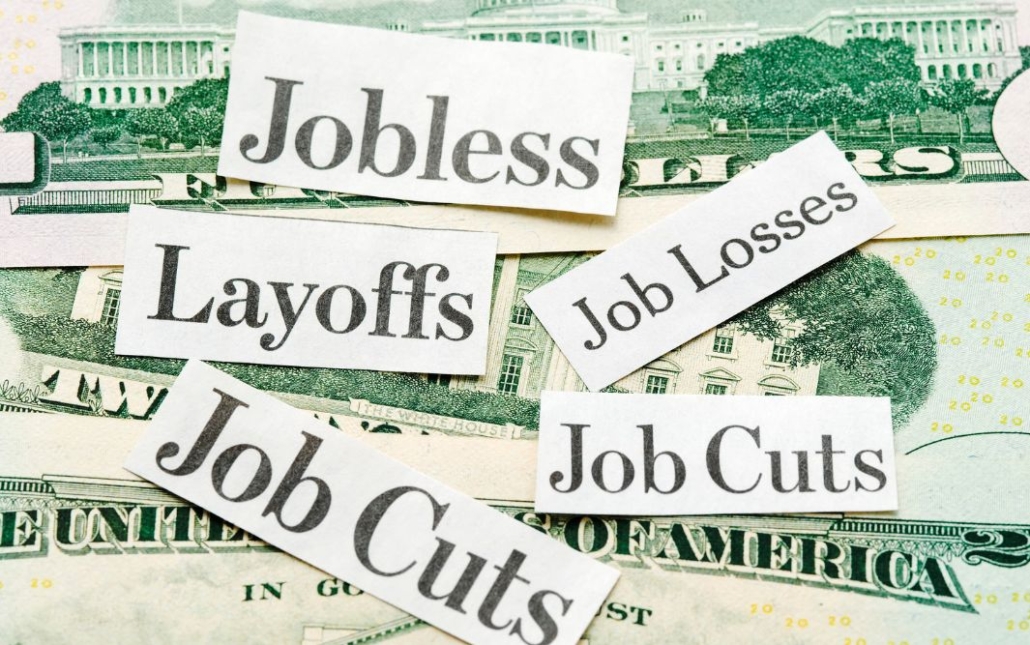
Job layoffs accelerated +136% in just one month between January 2024 and December 2023. Cash reserves held at banks are near all-time record lows right now. A recent survey found that 60% of the U.S. population has $500 or less in their checking accounts. Just 12% of the U.S. population has $2,001 dollars or more in their checking accounts, as per GoBankingRates.

Ballooning Corporate Debt

The U.S. corporate loan maturity amounts that ballooned or will be ballooning or coming all due and payable by the following year-end dates:

  • December 2023: $230 billion
  • December 2024: $790 billion
  • December 2025: $1.070 trillion
  • December 2026: $1.105 trillion
  • December 2027: $1.055 trillion
  • December 2028: $1.240 trillion
  • December 2029: $802 billion

Many corporations will be forced to refinance their debt at much higher rates while increasing their costs and decreasing their profits. As a result, more corporations will likely look to reduce their monthly costs, which may include increased job layoffs, sadly.

Between October 2019 and April 2023, there were more jobs created for foreign-born workers than for native American workers, as per ZeroHedge. My guess is that the foreign worker percentages have increased at an even faster pace between May 2023 and January 2024. In 2023, there were more illegal immigrant crossings in the USA each month than the total number of monthly births for US residents.

Government and Consumer Debt

According to Michael Snyder’s article entitled The United States Has The Biggest Government In The History Of The World By A Very Wide Margin, let’s take a look at some of these published numbers:

  • Upwards of 3 million people work for the federal government.
  • The federal government spent 6.13 trillion dollars in 2023. This figure is larger than the GDP of every nation on the planet except for the U.S. and China.
  • More than 70 million Americans are on Social Security.
  • More than 65 million Americans are on Medicare.
  • More than 81 million Americans are on Medicaid.
  • More than 41 million Americans are on food stamps.

Consumer and government spending trends: US households racked up $17.29 trillion in record debt last year (mortgages, credit cards, auto loans, student loans, etc.). The federal US debt crossed another milestone recently, surpassing $34 trillion. By comparison in 2009, US debt was only $10.6 trillion. Between 1980 and 1990, the total overall federal debt only increased by $2 trillion.

We’ve borrowed:
* $1 trillion over the last 3 months
* $2 trillion over the last 6 months
* $11 trillion over the last 4 years

In the previous housing crash here in California (2007 to 2012), average home prices fell to a still all-time state record amount of -41.7% from peak to trough.

  • Nearly 30% of Americans are behind on one or more debt payments.
  • 56 million Americans had unpaid credit card balances for more than a year.
  • 40% of student loan borrowers have still not made a payment even after the recent October 1, 2023 student loan payment restart date after three years of C-19 forbearance.
  • Just one late payment can drop a FICO credit score between 80 and 180 points.

Out of Chaos Comes Opportunity

Inflation is likely to remain elevated here in 2024. Historically, the ownership of real estate has proven to be an exceptional hedge against inflation while rising at a similar pace or higher each year.

With consumer debts at all-time record highs and credit card APR rates hovering between 28% and 30%+ and early paycheck loans reaching as high as 330% to 400% APR rates, it’s very important to limit your spending, set aside as much cash as possible if this may be an option for you, and keep your eyes focused on potential real estate bargains in your region.

During volatile economic time periods like seen back during the Great Depression (1929 – 1939), the Savings and Loan Crisis (‘80s and ‘90s), and the Credit Crisis or Great Financial Recession (2007 to 2012), there were incredible buying opportunities for discounted real estate. Please stay focused on your goals and targets rather than on the temporary obstacles.


Rick Tobin

Rick Tobin has worked in the real estate, financial, investment, and writing fields for the past 30+ years. He’s held eight (8) different real estate, securities, and mortgage brokerage licenses to date and is a graduate of the University of Southern California. He provides creative residential and commercial mortgage solutions for clients across the nation. He’s also written college textbooks and real estate licensing courses in most states for the two largest real estate publishers in the nation; the oldest real estate school in California; and the first online real estate school in California. Please visit his website at Realloans.com for financing options and his new investment group at So-Cal Real Estate Investors for more details. 


Learn live and in real-time with Realty411. Be sure to register for our next virtual and in-person events. For all the details, please visit Realty411.com or our Eventbrite landing page, CLICK HERE.

Helping Realtors Find Clients and Listings in 2024

By Rick Tobin

For many licensed real estate professionals and investors, this year will likely be the most important year for their career and investment strategies. I could write the same thing for the start of any previous year because it’s true for almost every single new year that brings us new opportunities.

I’ve held various real estate broker licenses in multiple states over the past few decades, so I fully understand the pressure that real estate licensees are under to find new clients and listings. I’ve also written college textbooks and courses (economics, finance, and real estate) in most states for the top 2 largest U.S. real estate educational firms and for the oldest and best-known real estate school in California.

Whether you just passed your very first real estate exam or have been an “old pro” for the past few decades like me, please reach out to me and we will work together to create a marketing plan for your target region. I’m also available online for brokerage office meetings and can be found as a new OnZoom instructor on their national public platform that’s linked here: OnZoom – Rick Tobin.

REALTOR® Statistics

  • In 2023, the U.S. had 1,566,354 Realtors, members of the National Association of Realtors, out of approximately 2 million real estate agents.
  • There have been between 200,000 and 300,000 active real estate licensees in California in recent years, depending on the boom and bust cycles.
  • Sixty-four percent of REALTORS® were licensed sales agents, 20 percent held broker licenses, and 18 percent held broker associate licenses.
  • The typical REALTOR® is a 60-year-old white female who attended college and is a homeowner.
  • 62% of all REALTORS® are female, and the median age of all REALTORS® is 60.
  • Real-estate experience of all REALTORS® (median): 11 years
  • Median tenure at present firm (all REALTORS®): 6 years
  • Most REALTORS® worked 30 hours per week in 2022.
  • The median gross income of REALTORS®—income earned from real estate activities—was $56,400 in 2022, an increase from $54,300 in 2021.
  • REALTORS® most often prefer to communicate with their clients through text messaging, at 94%. Ninety-two percent preferred to communicate via telephone, and 90% through email.
    Source: National Association of Realtors

Marketing Strategies for Realtors and Others

Attention spans: You have just 7 or 8+ seconds to quickly capture your readers’ or viewers’ attention span with a print or digital media ad. Focus on their needs and wants, not yours, for a higher rate of response (1% or higher).

Cash-on-cash advertising returns: The investment return for every $1 invested in your advertising campaign. For example, you invest $100 and collect $10,000 from a future closed commission at a 100-to-1 return on your investment.

Print media: Forms of marketing that can be held in your hand like mailed letters, postcards, flyers, newspapers, and magazines. Please avoid blind ad risks when you don’t clearly identify yourself as a real estate licensee.

Digital media: Online ads can be found on your blog, website, social media, and in native ads or sponsored ads (examples: Facebook, Google, Nextdoor, Alignable, Taboola, Outbrain, etc.). Email, text, and telephone marketing also work if the prospects aren’t on any do-not-call lists that exceed 300 million phone numbers.

Repetition is the key to programming and advertising. The more often that consumers see your ads online and/or in print media, the more likely they will remember you before contacting you for your services.

Merge print and digital media: The addition of a QR code on a print media design, which readers can scan with their phones prior to them seeing your online home listing or personal website, is an exceptional combination of both print and digital media at the exact same time at a fraction of the cost. There are free or affordable QR sites that will take your websites and convert them into a new QR code (Adobe, Canva, etc.).


article continues after advertisement


Social Media Marketing Numbers

Numerous published studies note that younger Americans are spending somewhere between 4.8 and 6+ hours on social media and a grand total of closer to 9 to 11+ hours on all types of media (gaming, television, movies, videos, etc.) every single day. If you want to reach your target audience for young first-time home buyers and older prospects, they’re found online.

With first-class stamps reaching 68 cents in January 2024 (3rd increase in a year; it’s rumored to rise to 70 cents in July ‘24), digital media ads may be more affordable and effective than print media.

Top 10 Social Media Apps (October ‘23)

1. Facebook: 3 billion (monthly active users)
2. YouTube: 2.5 billion
3. Instagram: 2 billion
4. TikTok: 1.2 billion
5. Snapchat: 750 million
6. X (Twitter): 541 million
7. Pinterest: 465 million
8. Reddit: 430 million
9. LinkedIn: 350 million
10. Threads: 100 million

The flip side of this print vs. digital media debate is that you will probably have much less competition this year when mailing letters and postcards because of the high postage costs. Will this translate to a much higher rate of response from your target audience? Please share with me later this year about which marketing strategies are working and which ones aren’t as effective so that we can learn together.


article continues after advertisement


Distressed Properties & Home Listing Opportunities

Listed below are strategies to either save distressed properties from being foreclosed and/or ways to generate new home listings:

  • Forbearance agreements: The lender agrees to postpone or delay their foreclosure actions with the delinquent borrower. These foreclosure postponements can last months or years.
  • Forbearance moratorium expirations: The Covid-19 FHA forbearance moratoriums ended on November 30, 2023, which may affect millions of distressed FHA borrowers who haven’t made a payment for upwards of 3+ years ($100,000+ in unpaid mortgage debt?). The VA moratoriums were extended until May 31, 2024, partly since the federal government probably didn’t want too many distressed home listings hitting the market at the same time. Please consider sending mailings out to both FHA and VA borrowers.
  • Loan modification: The lender or mortgage service company agrees to reduce the existing interest rate and/or monthly payment so that the loan is more affordable as a way to avoid foreclosure.
  • Deferment: The lender agrees with the borrower’s request to delay their delinquent payments until a future date. The late payments and penalties are added years later when the loan becomes due.
  • Reinstatement: After the borrower and lender agree to modify the monthly payments to avoid foreclosure, the loan is reinstated in good standing.
  • Short sale: If and when the mortgage debt is greater than the current market value for the home (aka “upside-down” or “underwater”), the owner should contact me so that I can negotiate a discounted mortgage payoff and help you obtain the listing and find a buyer. My past client worked on 6,000 short sales (#1 in the US) many years ago and I was their main mortgage broker.

Target the Subconscious Mind

Your subconscious mind is a type of automatic thinking center where your desires to purchase or sell a product or service truly originate. Most people are “impulse buyers” who quickly purchase a product, service, or asset like a home without really thinking it through and closely analyzing the potential pros and cons associated with moving forward with the purchase.

Repetition is the key to programming or deeply influencing others as I intentionally wrote earlier for better memory recall. Advertisers know this as well, so they continually flood your digital screens over and over to inspire you to purchase their products or services offered.

A simple way to find out what your target audience (one person standing next to you or in a hotel ballroom filled with 1,000 people) is to ask them a question like “What do you really want in life?” For many people, they will likely respond with love and money. It’s your turn then to show them how your product or service will help them later find love and money as you build the sales presentation around their needs and interests, not yours.

Interesting Subconscious Mind Facts:

  • It records everything.
  • It’s automatic and fully alert.
  • It takes almost everything literally.
  • It’s built on habituation and repetition.
  • It controls 95% to 99% of our thoughts and beliefs.
  • It’s one million times more powerful than our conscious mind.
  • It’s deeply affected more by voice tones, body language, numbers, and symbols than spoken or written words.

Influential Sales Strategies: Dale Carnegie

Warren Buffett, one of the most famous wealth builders in the history of the world, publicly gives full credit to Dale Carnegie for helping him overcome his overwhelming fear of public speaking and later becoming one of the best-known sellers and investors of all time.

I also took this brilliant Dale Carnegie course shortly after graduating from USC. To this day, I continue to use many of the same marketing and selling techniques that I learned while also sharing them in real estate and finance courses that I create for others.

A key component of a Dale Carnegie sales and speech course includes the A.I.C.D.C.: Attention, Interest, Conviction, Desire, and Close strategy. Let’s look next at how this sales concept can help you:

A (Attention): You’ve got about eight seconds to grab attention either online or in print like with a postcard. Either way, colorful and vivid images can attract your viewers’ eyes to your ad. In person, you grab their attention by learning their name (usually our favorite word), repeating it every so often, and talking primarily about them and their needs and interests to build rapport and trust.

I (Interest): Please think of the initial attention as akin to a “spark” that you must kindle by boosting the “flames” of interest by continuing to focus on your clients’ needs and interests. Keep asking them questions to find out their root needs and interests. You then speak to them by sharing how your product or service can give them exactly what they’re seeking.

C (Conviction): During this stage, you as the salesperson are certain that the client is interested in what you’re offering. Now, you offer valuable eye-opening statistics to support your claims.

D (Desire): You repeatedly show the prospect how the features or benefits of your product or service will get them what they desire (“Fact, Bridge, Benefit” technique). When successful, the customer’s desire to purchase your product or service will rise from low to high rather quickly.

C (Close): The absolute most important sales step is to close ‘em by asking them to buy your product. Your client may be 100% interested in your product, but may not know what to do next. It’s here where you show them how easy and simple it is to buy your product or for them to sell their off-market home with seller-financing that you mutually agree to and close the deal within a few days. Ask for the close and it’s more likely to happen.

Building a Trusted Network

● Circle or Sphere of Influence: Your friends, family, classmates, current and former co-workers, and connections from clubs, church, and networking groups and their connections as well that may number in the hundreds or thousands of people.

● These friends, family, and business professionals may be found at the local Chamber of Commerce, American Legion, Rotary Club, and Elks Lodge as well as with our Trusted Business Partners (TBP) networking group.

● Building a support network helps alleviate the burden of financial distress and increases opportunities like with our So-Cal Real Estate Investors group that meets at Canyon Lake Golf Club, Shoreline Yacht Club in Long Beach, and online.

● You’re more likely to take on the traits of the five main people in your circle of friends, family, and/or advisors, so choose wisely!!!

Helping Realtors & Investors Close More Deals

I’ve created hundreds of articles about fix-and-flips, short sales, seller-financing (subject-to, wraparounds, & paper flips), foreclosure bailouts, and was featured on the cover of Creative Real Estate Magazine (I was their #1 most published author for 10 years).

  • I’ve taught real estate licensees and investors across the nation how to find clients, distressed properties, and boost their sphere of influence to find more clients and homes to sell or buy.
  • If you or your clients have credit issues, I’ve written courses about credit for the two largest real estate publishers in the nation and may help quickly increase your clients’ FICO credit scores.
  • I can get you fast pre-approvals and help structure the offer with maximum credits to minimize cash to close.
  • My Realloans team and I will simplify your complex deals so that you and your clients are relieved, calm, happy, and close on time.
  • I’m affiliated with hundreds of real estate investment clubs and 1031 tax-deferred exchange groups, which have tens of thousands of qualified or all-cash buyers who can close quickly.
  • I will help your listings by sharing mortgage flyers with you and on my networking platforms to optimize viewer traffic.

2024 can either be your best year ever as a real estate licensee, or investor or it could be quite challenging if you’re not willing to make necessary changes. The choice is yours and yours alone as to your willingness to attempt new creative marketing strategies to boost your sales and purchase numbers.

I’m here to help you reach and surpass your goal targets. The best time to start is today, not next year. Best wishes for success in 2024 and beyond!


Rick Tobin

Rick Tobin has worked in the real estate, financial, investment, and writing fields for the past 30+ years. He’s held eight (8) different real estate, securities, and mortgage brokerage licenses to date and is a graduate of the University of Southern California. He provides creative residential and commercial mortgage solutions for clients across the nation. He’s also written college textbooks and real estate licensing courses in most states for the two largest real estate publishers in the nation; the oldest real estate school in California; and the first online real estate school in California. Please visit his website at Realloans.com for financing options and his new investment group at So-Cal Real Estate Investors for more details. 


Learn live and in real-time with Realty411. Be sure to register for our next virtual and in-person events. For all the details, please visit Realty411.com or our Eventbrite landing page, CLICK HERE.

How to Overcome Declining Purchasing Power with Real Estate

By Rick Tobin

Homeowners are 40 times wealthier than tenants. Real estate is an exceptional hedge against inflation because home values tend to rise at least as high as the published inflation rates.

If you’re fortunate to own real estate over years or decades, it’s very likely to be the main reason for the bulk of your family’s overall net worth. Conversely, tenants will be losing money over time as their rents continue to rise right alongside skyrocketing inflation rates.


article continues after advertisement


Americans in 2023 need to earn more than $11,400 to be able to enjoy the same standard of living as they did in 2021 thanks to the rapidly declining value of our dollar, according to CBS News.

If your earnings rose by 34% from January 2020 to October 2023, the purchasing power of your labor kept pace with higher costs. All of us who aren’t earning 34% more since January 2020 have lost ground. It now takes more hours of work to buy groceries and everything else. To offset declining purchase power, real estate ownership may be your best option.

The purchasing power of $100,000 in income in January 2020 is only $66,000 in purchasing power today (34% reduction). To keep pace with the rapidly falling purchasing power of the dollar, $100,000 in income in January 2020 would need to rise to $134,000 in income today or your investments would need to appreciate at the same rate to offset your dollar losses.

Rising Prices for Goods, Services, and Assets

Between 2008 and the 1st quarter of 2023, let’s review some of the “official” government published data for consumer goods, services, and assets from sources such as the U.S. Bureau of Labor Statistics:

  • Hospital services: +99.8%
  • College tuition: +64.4%
  • Child care: +62.1%
  • Medical care: +57.2%
  • Food and drink: +52.8%
  • Housing: 48.3%

Again, these are the published numbers that are likely underreported and much lower than the true inflated price changes. To me, it seems like all prices are significantly higher here in the 4th quarter of 2023 as compared to the 1st quarter this year. If so, the actual price gains may be significantly higher as we head into 2024.

All-Time Record High California Home Prices

In spite of mortgage rates more than tripling over the past year or so, housing prices statewide in California have never been higher for owners, new buyers, and tenants.

Shocking Los Angeles Home Price Swings

The median home sales price in Los Angeles County hit a record high of $914,640 in September 2023.By comparison, the median Los Angeles County home price was $318,075 (12/08).

Near the peak of the previous housing bubble and near the official start of the Credit Crisis or Great Financial Recession in late 2008, the median home sale price was almost $600,000 lower in Los Angeles County than median-priced homes in the same region. How is this not shocking?

Today, Los Angeles is ranked as the #2 most expensive U.S. city and the #6 most expensive worldwide city for residents to live in, according to KTLA News.

Many California homeowners have never been wealthier due to rapidly increasing home equity gains while many tenants have never been poorer due to their all-time record high rental payments, sadly.


article continues after advertisement


Expensive Coastal Regions and Inland Moves

Because some of the most expensive real estate prices in the world are located in California coastal counties like San Diego, Orange, Los Angeles, Ventura, Santa Barbara, and San Francisco (both a city and county name), more residents are moving inland to places like Riverside or San Bernardino counties in Southern California or out of state to Arizona, Nevada, or Texas.

Buyer demand still exceeds the available home supply while pushing home prices higher, especially in the Riverside County region, which is much more affordable than the near $840,000 statewide home price average for California.

Riverside County Home Spotlight Region

The median sale price of a single-family home in Riverside County was a new all-time record high of $620,960 in October 2023, up from $600,000 in September, with a rise from $599,990 in October 2022, according to the California Association of Realtors.

  • Lake Elsinore: $575,000 ($175,000 below the Temecula average)
  • Canyon Lake: $662,000
  • Menifee: $547,500
  • Murrieta: $657,500
  • Temecula: $750,000
  • Corona: $759,000

Adding Value to Real Estate

Owners or interested buyers who are thinking about purchasing a new one-to-four unit property to boost their wealth and/or monthly income with rental units have several options these days which may include:

  • First-time owner-occupied homes
  • A move-up from a smaller to a larger home
  • A short-term or long-term rental
  • Adding tiny homes or ADU (Accessory Dwelling Unit) to a residential property site to increase monthly cash flow.
  • Remodeling an existing home with a new kitchen, bathroom, or bedroom.
  • Building a brand new home, duplex, triplex, or fourplex from the ground up.

One-Time Close Construction Loans

I’ve worked on numerous individual home construction loans and large residential development tracts over the past few decades. Yet, I’ve never seen a better, easier, and more affordable home construction loan option for owners who are interested in building a brand new “dream home” for their family.

Generally, a person may need two or three separate loans to build a new home that may include a land purchase loan (40% to 50% LTV ranges are more the norm), construction loan, and a final 30-year takeout or permanent loan to pay off the construction loan.

With a One-Time Close Construction Loan, the borrower applicant qualifies for one loan to buy the land, build the home, and keep the same loan for up to 30 years all within one loan closing option. This way, there’s one credit report pull, one loan underwriting and approval process, one down payment unless it’s a VA loan (up to 100% financing) or a very low down payment requirement for FHA-insured and conventional loans (up to 95% to 96.5% LTV).

Let’s review below some of the loan product highlights offered by one of my main lending partners:

Conventional Loans

* Available on 15-and 30-year fixed conventional, high balance and 7- and 10-year ARM options
* Eligible on primary, second or vacation home, and investment property purchases and rate/term refinances
* Loan amounts up to the conforming loan limits
* 700+ FICO, up to 95% LTV
* 11-month maximum build period with 1-month modification period
* Interest-only monthly payments during the build period

VA Loans

* Available on 30-year fixed loans
* Loans up to $4M
* Eligible on primary home purchases and cash-out refinances
* 580+ FICO, up to 100% LTV
* 11-month maximum build period with 1-month modification period (build period is deducted from the loan term)
* No monthly payments during the build period

Rule of 72 and Power of Leverage

Real estate has proven to be an exceptional hedge against inflation over the past 100 years. In some economic boom years, home values may double in value every 2, 3, 5, 7, or 10 years. With minimal down payments, the true annual cash-on-cash returns are much higher than most people realize.

The Rule of 72 is an investment formula used to estimate how long it may take for an asset to double in value using a projected annual rate of return. If homes in your region have increased 7% per year over the past several years and home appreciation continues at the same pace in the future, then it may take 10+ years for your new home to double in value using the Rule of 72 (72/7 or 7% = 10+ years).

Most first-time home buyers use high mortgage leverage within a 0% to 6% down payment range (6% down is average).
Let’s use 20% down payment for an estimated cash-on-cash return for an owner-occupied or investment property buyer. At a 7% annual appreciation rate average, the cash-on-cash return is actually 5 times 7% (20% down – 1/5th; 80% bank – 4/5th) for a total 35% annual cash-on-cash return.

Time and inflation can be two great allies to eliminate the mortgage debt as your home rises in value thanks to the power of leverage and inflation.

Is the housing market positive, negative, or neutral? It depends on the home region, the regional home listing inventory supply, and the price range is perhaps the safest answer to give.

Why doesn’t it feel like a slow home sales market to first-time buyers? Let’s take a closer look at the national home sales numbers for October 2023 as provided by the National Association of Realtors:

  • 66% of homes for sale were sold in less than a month.
  • 62% of surveyed real estate professionals said that their first-time home buyers had to put in four or more offers before closing on a home.
  • The median home sales price for an existing home was $391,800, up 3.4% compared to a year ago.

Invest in Your Future Today

The average homeowner at retirement age has 83% of their net worth tied up in their primary home. 60%+ of Americans surveyed say that they live paycheck to paycheck, so saving is challenging. Middle-income parents may spend an average of $310,605 by the time a child born in 2015 turns 17 years old in 2032, per Brookings Institute. What about college?

The average Social Security benefit paid out in 2022 was $1,657/mo. ($19,884/yr.). Median savings rate (excluding retirement funds) by age: $3,240 (under 35); $4,710 (35-44); $5,620 (45-54); and $6,400 (55-64), per a Federal Reserve survey. The median retirement savings for all families is $87,000, according to the 2022 Survey of Consumer Finances.

There’s good debt (mortgages) and bad debt (credit cards at 28% to 33% rates, etc.). Mortgages help create long-term wealth, especially after they are paid off in full. To shorten the time to pay off a mortgage, you might pay biweekly and add some principal to reduce 10 to 15+ years in payments while the home asset potentially doubles or triples in value.

Our dollar’s purchasing power is on track to continue falling in value. If so, the prices paid for consumer goods, services, and assets like real estate may keep rising as well. As a result, equity gains for real estate ownership may increase while giving you more options to pay off debt and build a brighter future.


Rick Tobin

Rick Tobin has worked in the real estate, financial, investment, and writing fields for the past 30+ years. He’s held eight (8) different real estate, securities, and mortgage brokerage licenses to date and is a graduate of the University of Southern California. He provides creative residential and commercial mortgage solutions for clients across the nation. He’s also written college textbooks and real estate licensing courses in most states for the two largest real estate publishers in the nation; the oldest real estate school in California; and the first online real estate school in California. Please visit his website at Realloans.com for financing options and his new investment group at So-Cal Real Estate Investors for more details. 


Learn live and in real-time with Realty411. Be sure to register for our next virtual and in-person events. For all the details, please visit Realty411.com or our Eventbrite landing page, CLICK HERE.

What’s Your Blended Debt Rate?

By Rick Tobin

A blended rate is a combination of interest rates on multiple loans for an individual or household and calculated as if they were just one rate.

Those very fortunate mortgage borrowers with existing 1st mortgage rates at or below 3% or 4% might be hesitant to choose a new cash-out refinance 1st loan to pay off their rising unpaid consumer debts that may vary between 10% and 30%+ each.

More than 40% of all U.S. mortgage borrowers funded their purchase or refinance loan in either 2020 or 2021 when rates were at or near historical lows, according to data published by Black Knight. Many homeowners don’t want to lose their record low rate by refinancing the mortgage debt or selling, which is akin to a lock-in effect.


article continues after advertisement


A blended rate analysis for an existing debt comparison to a new cash-out 1st or 2nd mortgage or HELOC (Home Equity Line of Credit) can be simplified by comparing the existing monthly debt obligations for the consumer with a proposed new cash-out mortgage or HELOC that pays off all of the existing mortgage and/or non-mortgage debt.

For example, the Jacksons have a $400,000 1st mortgage that has a 3% fixed rate for 30 years. They funded the loan near the all-time record low time period in early 2021 and now have just under 28 years remaining on the loan.

The Jacksons also have $50,000 in credit card debt that’s compounding at close to 30% and two used car loans which combine for another $50,000 that average near 12%. To simplify this calculation, I used the exact same balances for an easier interest rate calculation estimate of 21% (30% + 12% = 42% / 2 = 21%).

Let’s now add the $400,000 mortgage at 3% to the $100,000 in credit card and automobile loan debt at 21% for a grand total of $500,000. Four-fifths ($400,000) of the Jacksons’ monthly debt is at 3% while one-fifth ($100,000) is at 21%.

● $400,000 mortgage balance: 3% rate
● $50,000 credit card balances: 30% rate
● $50,000 automobile loan balances: 12% rate
● New blended interest rate for all debt: 6.6%

The Jacksons’ blended interest rate in this example is 6.6% for all of their monthly consumer debt when including their mortgage, credit card, and car payments.

The Jacksons explore their HELOC (Home Equity Line of Credit) options that would be recorded in second position behind their existing 3% fixed rate 30-year mortgage that they don’t want to lose.

As of October 18, 2023, the current average HELOC interest rate was 9.02 percent, as per Bankrate (all rates and fees are subject to change). Rates, fees, and APRs (Annual Percentage Rate) are all over the place, depending upon the lender, borrower’s creditworthiness, and daily financial market trends that may rise or fall.

With this HELOC rate estimate provided, we will explore both a 9% and 10% HELOC rate to get the Jacksons $100,000 to pay off their 30% credit card and 12% automobile loan rates.

● $400,000 mortgage balance: 3% rate
● A new $100,000 HELOC: 9% rate
● New blended interest rate for all debt: 4.2%

● $400,000 mortgage balance: 3% rate
● A new $100,000 HELOC: 10% rate
● New blended interest rate for all debt: 4.4%

Either way, a new HELOC that’s used to pay off consumer debt may decrease the total monthly blended rate for all monthly debt by at least 2% (6.6% blended rate – 4.2% or 4.4% blended rate = 2.4% to 2.2% blended rate improvement).


article continues after advertisement


My best HELOC programs (10-year interest only, 20-year amortizing) may be interest-only for the first 10 years while later adjusting to fully amortizing with principal and interest for a total loan term of 30 years. If I calculate these HELOC rates as interest-only for the first 10 years, the total blended rate payments would actually be even better.

To check your actual current blended rate debt as well as your potential future blended rate if you welcome a new HELOC loan, please enter your own consumer debt data (loan amount, rate, and number of individual loans) here to find out: Blended Rate Calculator.

The average borrower is in their home for about seven years, not 30 years. This is also about the average time period that a borrower holds one or two mortgage loans on their property before they later sell or refinance at a hopefully lower rate.

Snowballing or Compounding Credit Card Debt Examples

Credit card delinquency rates at small banks reached 7.51%, the highest level ever recorded according to the St. Louis Fed.

Average credit card rates surpassed 28% nationwide recently. However, retail store credit cards are now closer to 30%. By comparison, credit card rates averaged closer to 12% back in 2008.

In the 3rd quarter of 2023, new credit card delinquencies reached 7.2% according to the New York Fed Consumer Credit Panel and Equifax.

The average annual percentage rate (APR) for merchant cards, which many holiday shoppers will be using online or at nearby shopping malls, just hit 28.93%. This is a new all-time record, up from 26.72% in 2022, according to Bankrate.

Credit Card Debt Payoff Examples

Now, let’s compare how much time and interest is required to pay off a credit card debt balance of $20,000.

Many credit card issuers may have different minimum payment allowances which may vary from a minimal fixed dollar amount up to the interest plus 1% of the unpaid principal balance that’s paid monthly.

For example, let’s start with minimum payment example #1 that includes just interest-only with no principal paydown each month:

Credit card payment #1:
Unpaid credit card balance: $20,000
Interest rate: 28.93%
Annual interest paid for one year: $5,786 ($20,000 x 28.93%)
Monthly interest-only payments: $482.17 ($5,786/12 months)

If the borrower just pays the absolute minimum interest-only payment of $482.17 per month, it will take 41 years and 7 months to pay off the unpaid balance. If so, this is 11 years and 7 months longer than a brand new 30-year fixed rate mortgage.

The total interest paid by the borrower over this time period would be $220,496.44 (11 times the original $20,000 balance). To verify yourself, here’s the specific credit card payment example #1 link on Calculator.net.

Credit card payment #2:
Unpaid credit card balance: $20,000
Interest rate: 28.93%
Payment option: Interest + 1% of principal balance
Annual interest paid for one year: $5,786 ($20,000 x 28.93%)
Monthly interest-only payments: $482.17 ($5,786/12 months)
Payment of an extra $200 in principal ($20,000 x 1% = $200)
Total minimum monthly payment (interest + 1% of principal): $682.17

The payment of the absolute minimum interest-only ($482.17/month) plus 1% of the original $20,000 unpaid principal amount ($200 in principal) for a grand total of $682.17 per month will take 4 years and 4 months to pay off the entire balance in full. The total interest paid will be $15,134.49. To confirm yourself, here’s the specific link for credit card payment example #2 on Calculator.net.

Student Loan Debt

U.S. student loan balance: $1.8 trillion (fourth quarter of 2023)

Just 500,000 borrowers out of 43.5 million student loan borrowers, a 1.15% payment rate, were paying on time prior to the October 1, 2023 payment restart date. Many of these average $500+ per month student loans are adjustable and are likely to increase over time, sadly.

The average federal student loan debt is $37,338 per borrower. Private student loan debt averages $54,921 per borrower. Twenty years after entering school, 50% of the student loan borrowers still owe more than $20,000 each on outstanding loan balances, according to the Education Data Initiative (May 22, 2023).

Just 90 days after the October 1, 2023 student loan payment restart date, any ongoing delinquent student loan payments may be shared with the credit bureaus as early as January 1, 2024. If so, the FICO credit scores for delinquent student loan borrowers may begin to fall as their borrowing costs for future loans may rise as well.

Worsening Automobile Loan Sector

In September 2023, Fitch Ratings reported that 6.11% of automobile loan borrowers were at least 60 days late on their payments. This is the highest delinquency rate since the early 1990s.

While a 30-day late can often be a mistake by a borrower who forgot about their payment, a 60-day later indicates possible significant financial challenges. Few people want their car repossessed, so it’s usually a top priority monthly debt obligation that a borrower will focus on to get paid each month. Without a car, how does someone get to school, work, or to visit friends and family if they don’t have access to affordable and convenient public transportation nearby?

  • Average subprime car loan rates are reaching the 17% – 22% loan rate range.
  • The percentage of subprime auto borrowers who are 60+ days past due on loans hit an all-time record high of 6.1% in September (#2 highest: 1994 – 6.0%; and #3 highest: 2008: 5.0%).
  • The average new car price is now higher than $48,000.
  • Average new car payment rates are near $750/month and the average student loan payment is just over $500/month. For consumers with both forms of debt, they are paying close to $1,250 per month for just their car and student loan while not counting insurance, gasoline, or maintenance for the car.
  • The average used car price now is $30,700 as compared with an average used car price just under $8,000 back in 2008.
  • The average loan-to-value ratio for a used car is 125% LTV (no money down + taxes, license, registration, warranty, other fees, and declining value over time).
  • There are now 20,000 car repossessions PER DAY (600,000 per month) while rising exponentially each consecutive month. If the same pace of rising and compounding car repos continues onward, there might be upwards of one million car repos PER MONTH in 2024 (yes, one million per month).

There are approximately 100 million car loans across our nation. However, there are an estimated 276 million automobiles nationwide, so the car loan-to-total cars nationwide ratio is just over 36% (100 million/276 million = 36.23%).

Moody’s recently warned about potential automobile loan and credit card default rates as high as 9% to 10% in 2024. If so, this might be equivalent to nine to 10 million car loan defaults or repos out of the total 100 million car loans. If proven true, a nine to 10 million car loan default rate would make the one million car repossession projection for 2024 seem much too conservative and only a fraction of how bad the car delinquency numbers may reach.

California Mortgages: 50-Year Analysis

Between April 1971 and September 2022, the average 30-year fixed mortgage rate was 7.76%. Today’s 30-year fixed rates for consumers are fairly close to this historical 50-year average, depending upon their creditworthiness and whether it’s a conventional, FHA, VA, or non-QM type of loan.

The 30-year fixed rate peaked near 18.6% in October 1981. In January 2022, some 30-year fixed rates temporarily reached the high 1% to low 2% rate range.

Over the past 50 years, the typical California homebuyer spent 43% of their income on house payments. Today, the average homeowner spends closer to 58% to 65%+ of their monthly gross income on mortgage payments (principal, interest, taxes, insurance, and HOA, if applicable). After paying state and federal income taxes, many California homeowners are more likely paying closer to 70% to 80% of their net monthly income towards their monthly housing debt.

The median price of a California home over the past 50 years was $331,000. In September 2023, the median statewide price reached $843,340, according to the California Association of Realtors. This is almost more than double the median national home sales price that hit $431,000, as per the St. Louis Fed.

Over the past 50 years, the average monthly mortgage payment was $1,627 at 80% LTV with 20% cash down. In 2022, the average mortgage payment reached $4,043/month, a 148% increase.

In the fourth quarter of 2023, let’s review a potential new mortgage payment for a median home price in California that’s near $840,000:

Down payment percentage amount: 20% down payment (average is 6% down nationwide)
Down payment dollar amount: $168,000
New loan amount (80% LTV): $672,000
30-year fixed mortgage rate: 8% (example only, subject to change)
Monthly mortgage payment: $4,930.90 (principal and interest)

This example above does not include any monthly property taxes, insurance, or homeowners association (HOA) payments, if applicable.

The average household income for Californians over the past 50 years was $45,700. Today, the average income is closer to $84,000. This 84% increase in income isn’t enough to cover the 148% increase in mortgage payments, sadly.

A 20% down payment over the past half century for Californians was $66,000. In 2023, the average down payment increased to $168,000, which is a whopping $102,000 down payment increase.

Finding more affordable monthly blended rate payment options are what you should focus on these days as we all see consumer debt balances and interest rates either heading towards or surpassing all-time historic highs.

Please contact me today for a FREE blended rate analysis of your personal debt. You may be pleasantly surprised to learn how I can help reduce your overall blended rate, monthly payments, and possibly eliminate years or decades’ worth of extra debt payments.


Rick Tobin

Rick Tobin has worked in the real estate, financial, investment, and writing fields for the past 30+ years. He’s held eight (8) different real estate, securities, and mortgage brokerage licenses to date and is a graduate of the University of Southern California. He provides creative residential and commercial mortgage solutions for clients across the nation. He’s also written college textbooks and real estate licensing courses in most states for the two largest real estate publishers in the nation; the oldest real estate school in California; and the first online real estate school in California. Please visit his website at Realloans.com for financing options and his new investment group at So-Cal Real Estate Investors for more details. 


Learn live and in real-time with Realty411. Be sure to register for our next virtual and in-person events. For all the details, please visit Realty411.com or our Eventbrite landing page, CLICK HERE.